Wastewater Treatment Facilities and Sewage. Wastewater Treatment Facilities of the City of Osh
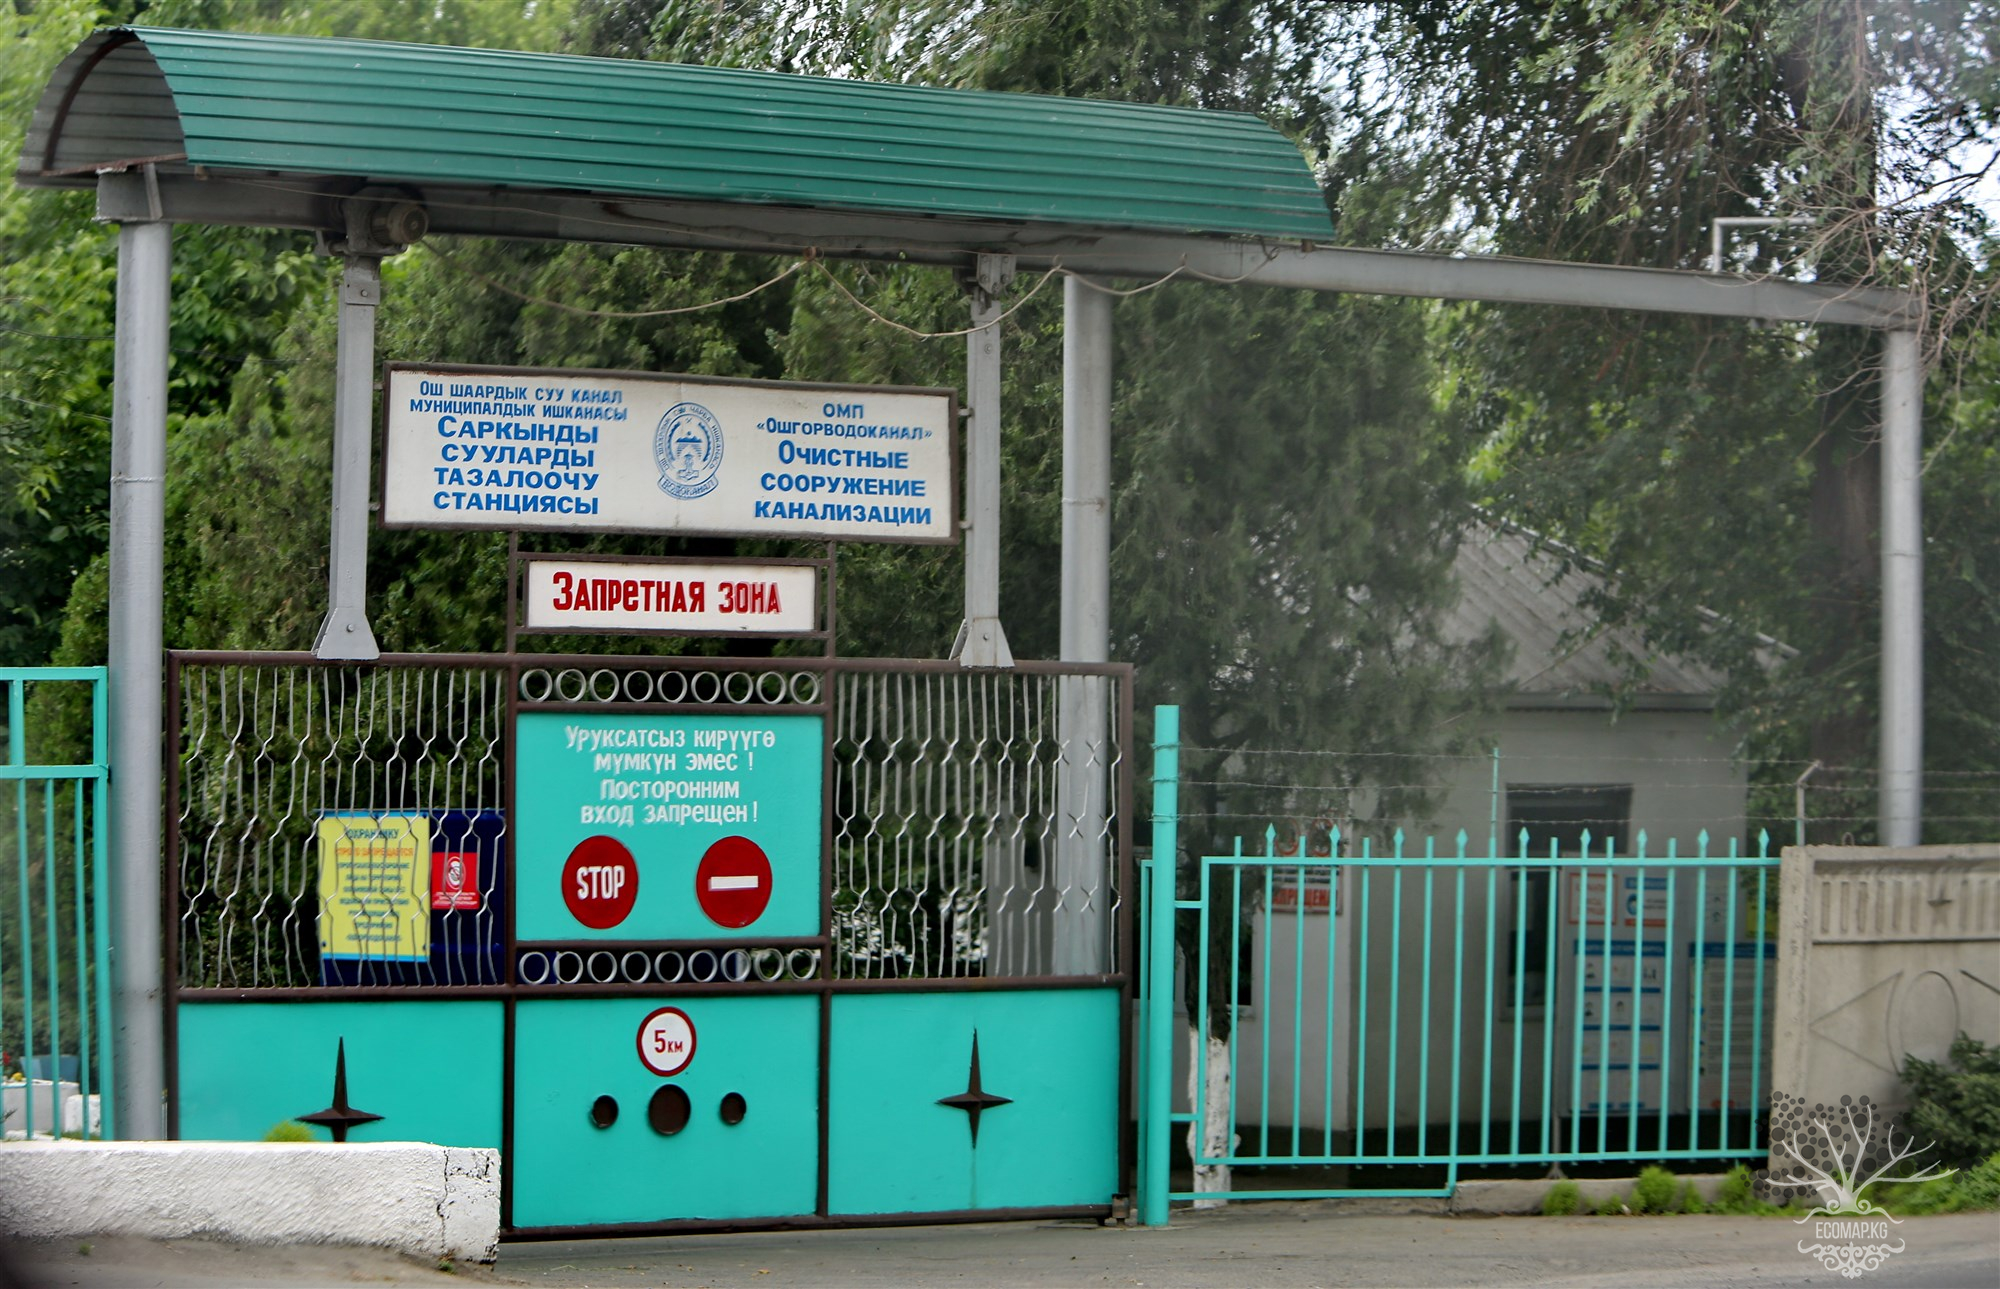
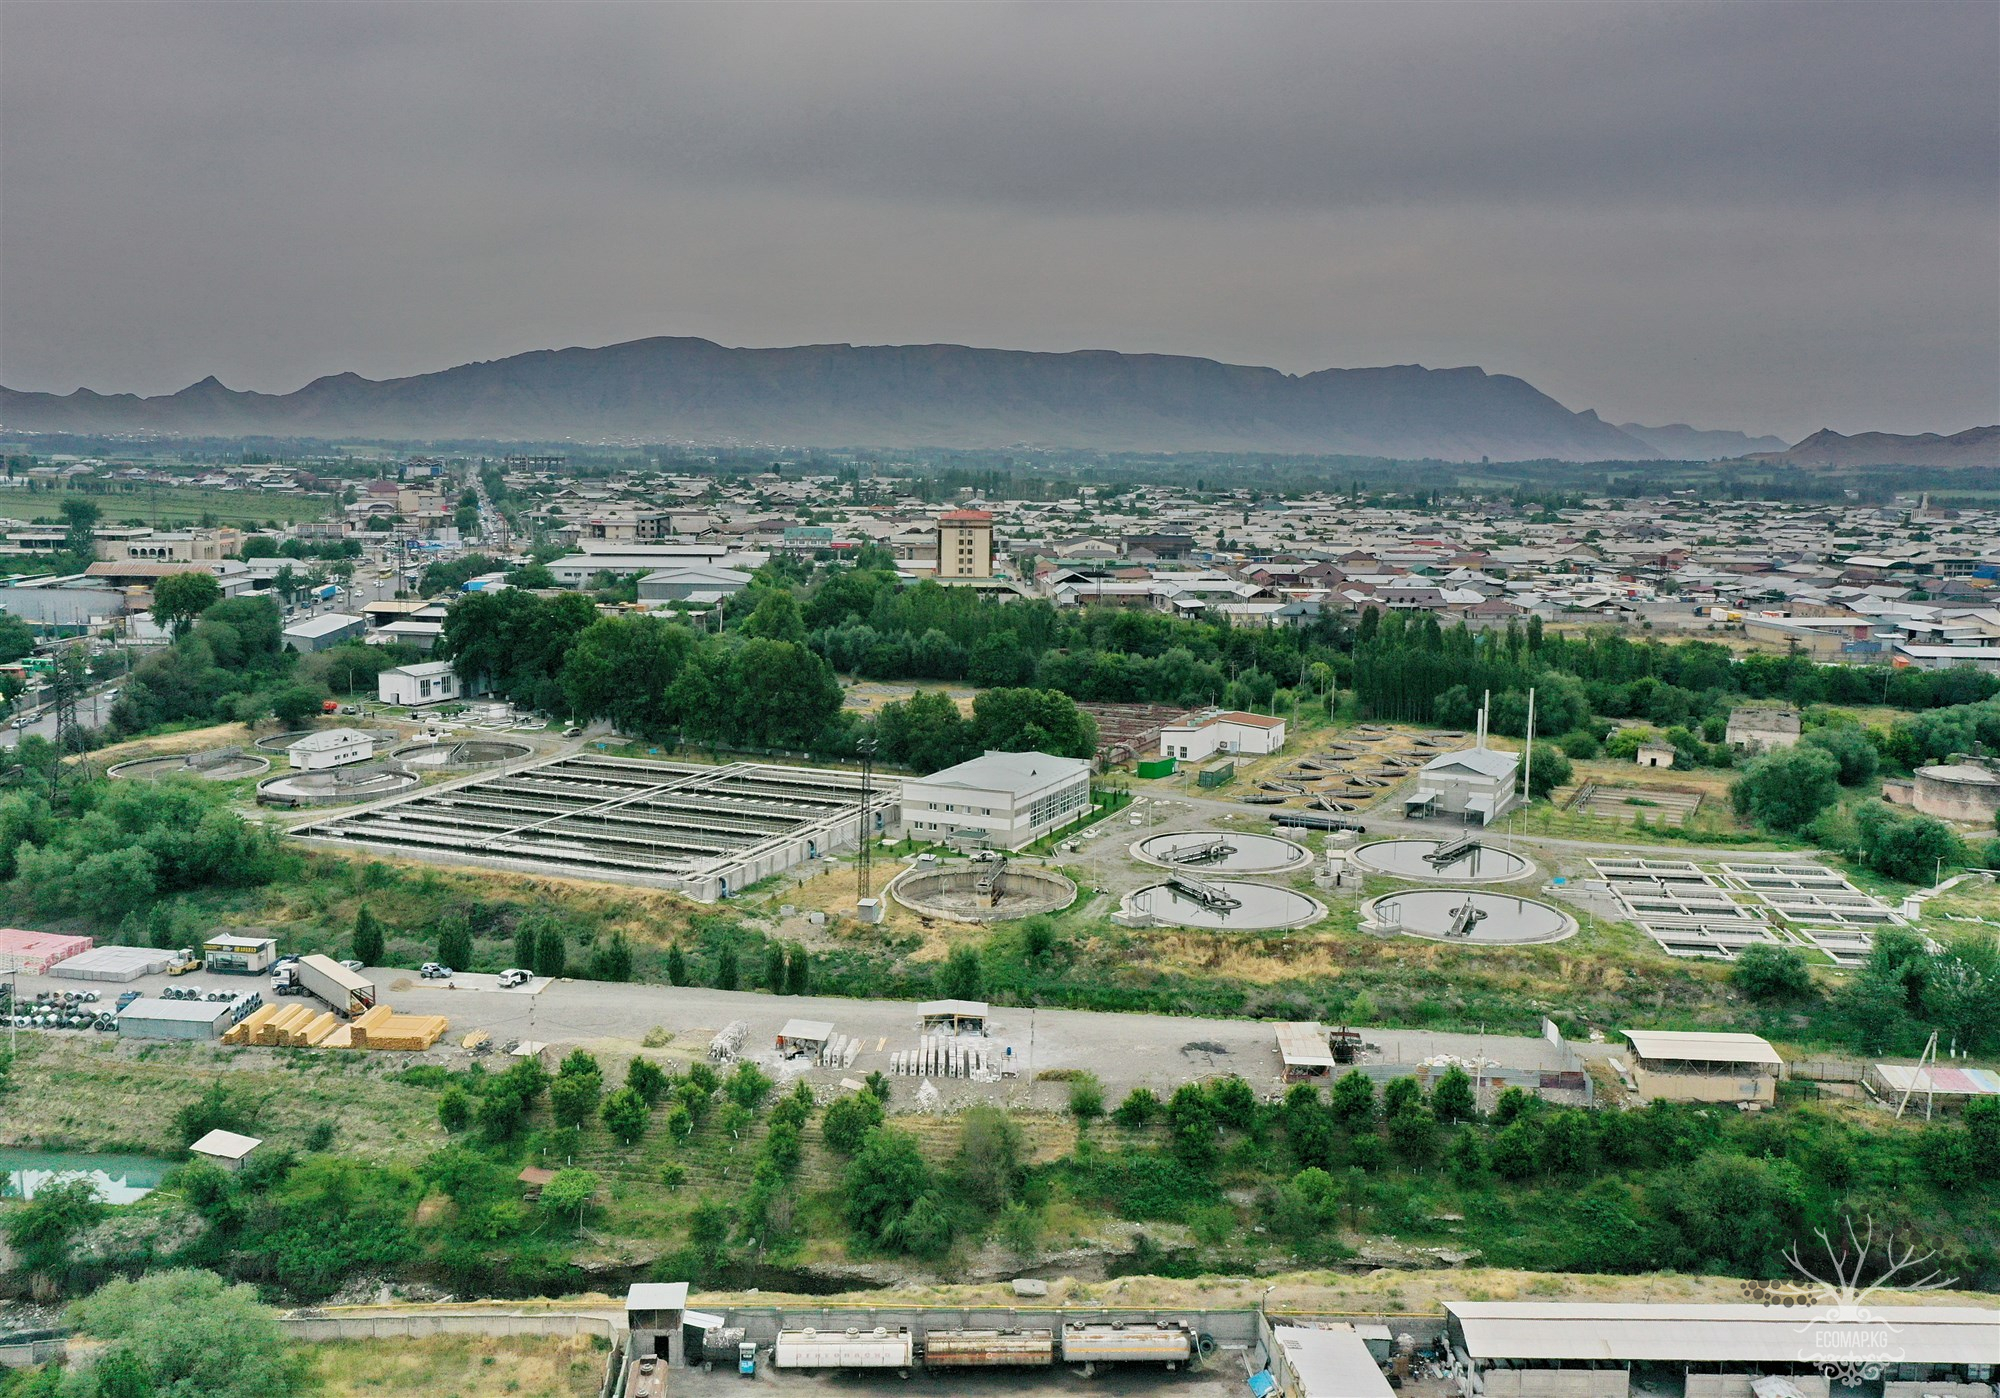
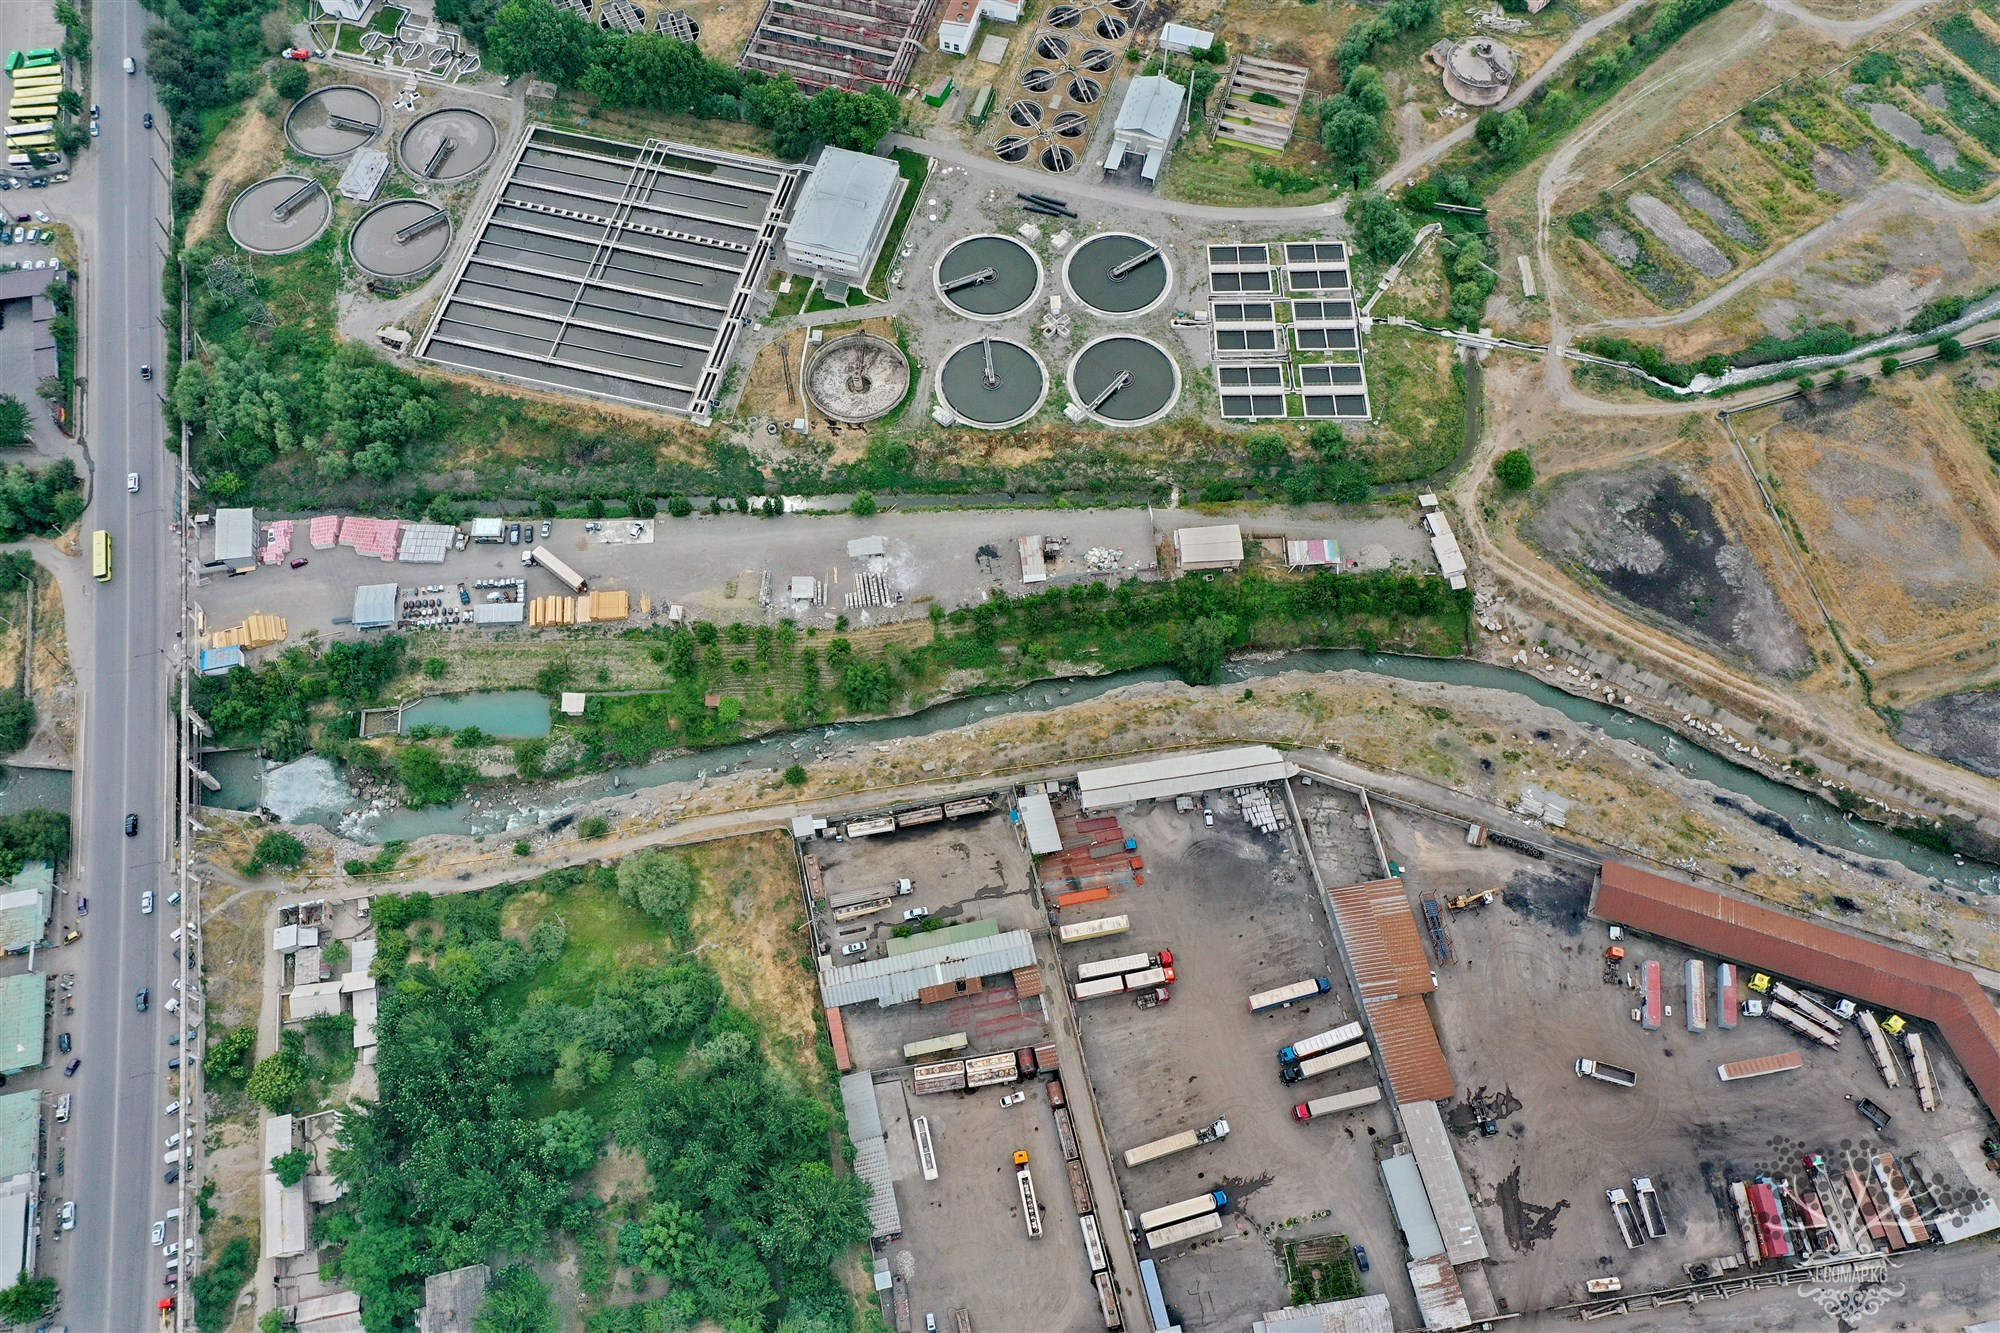
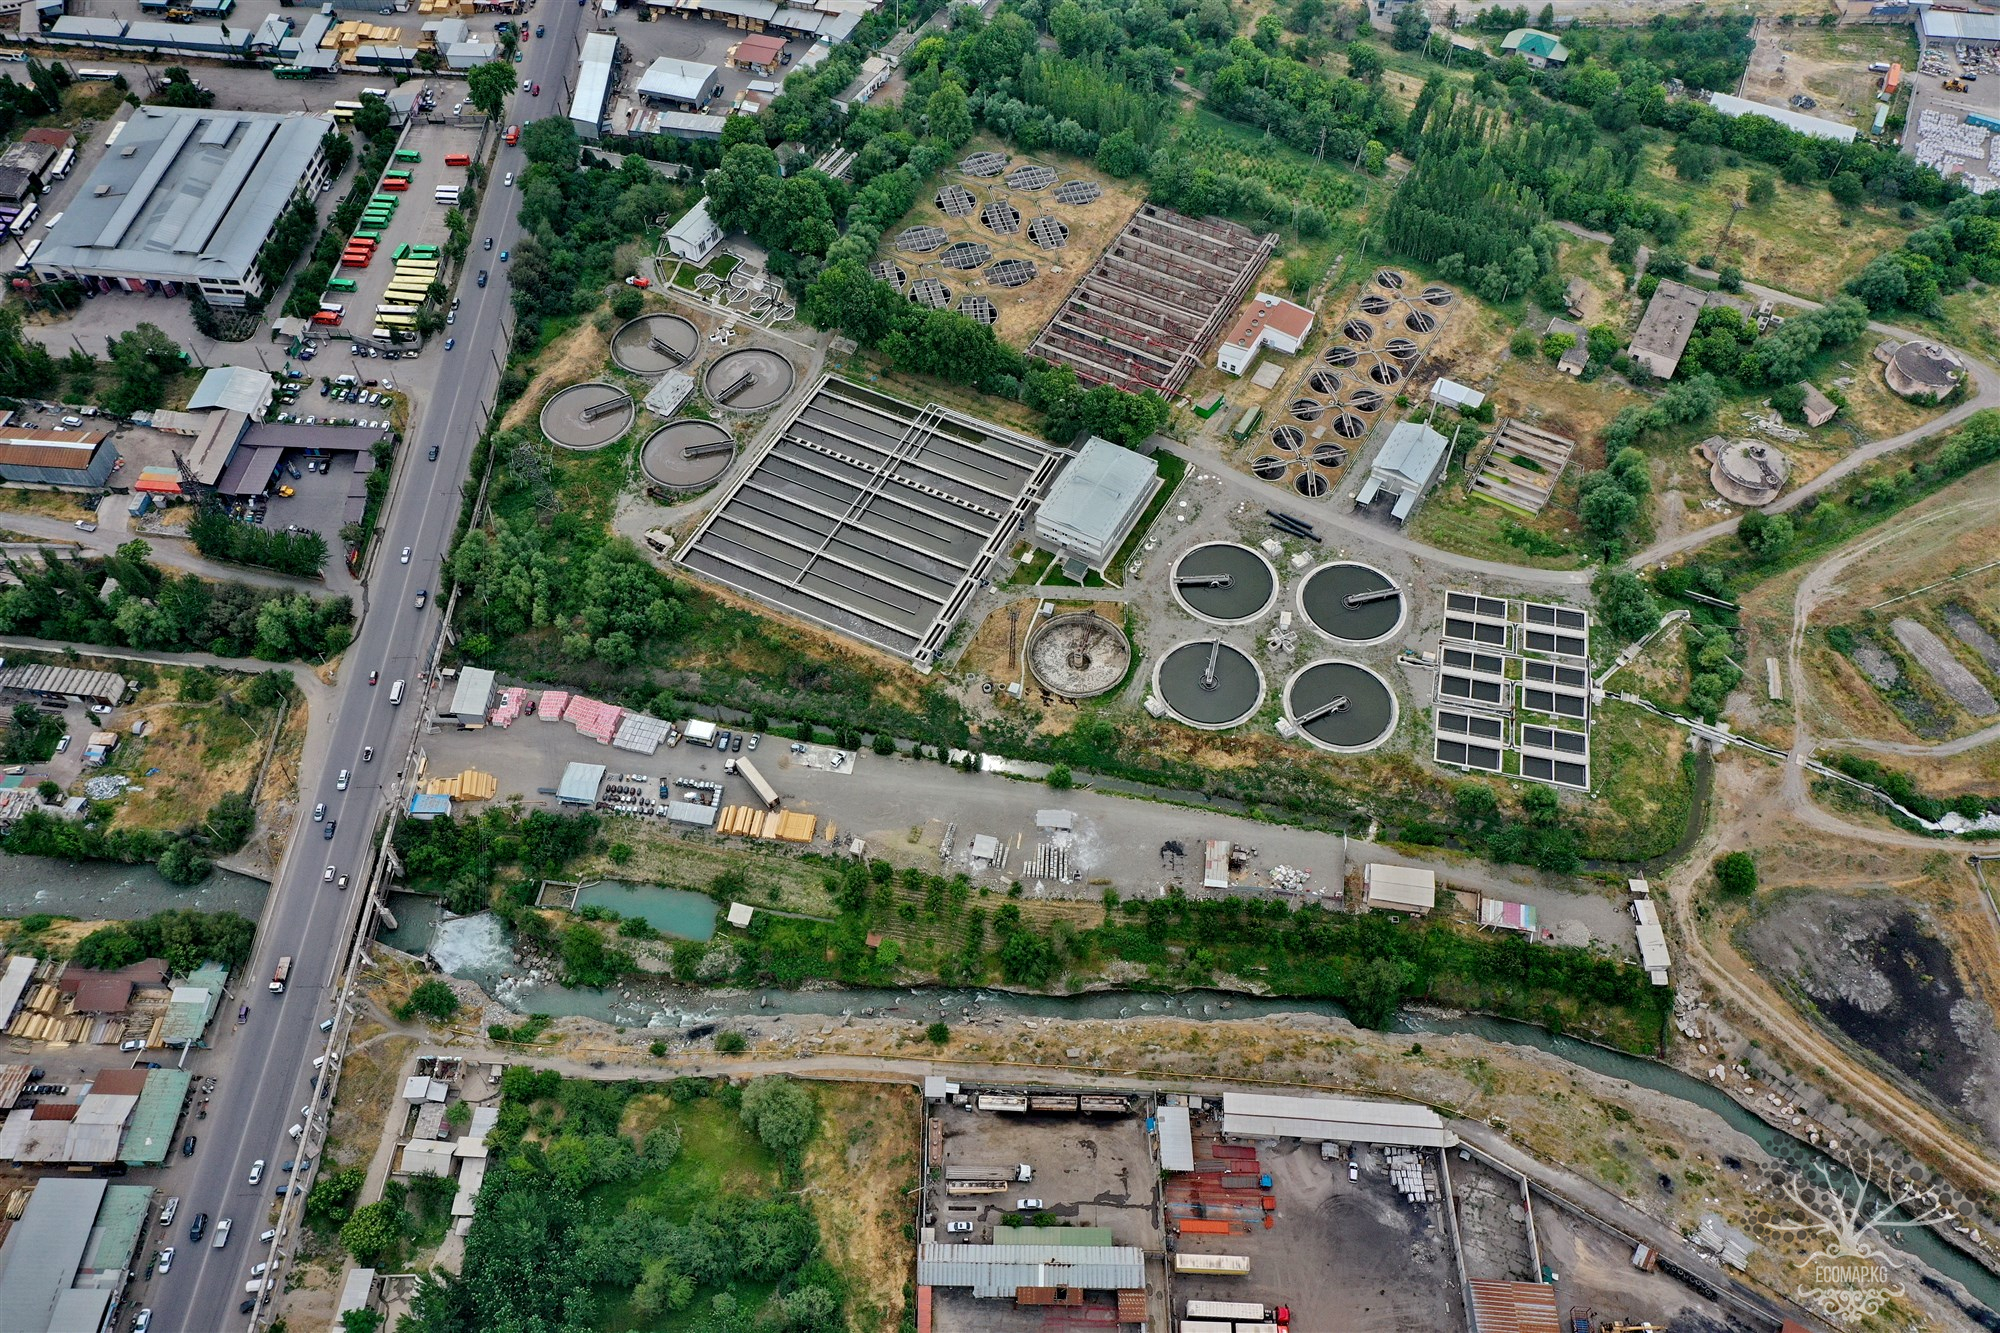
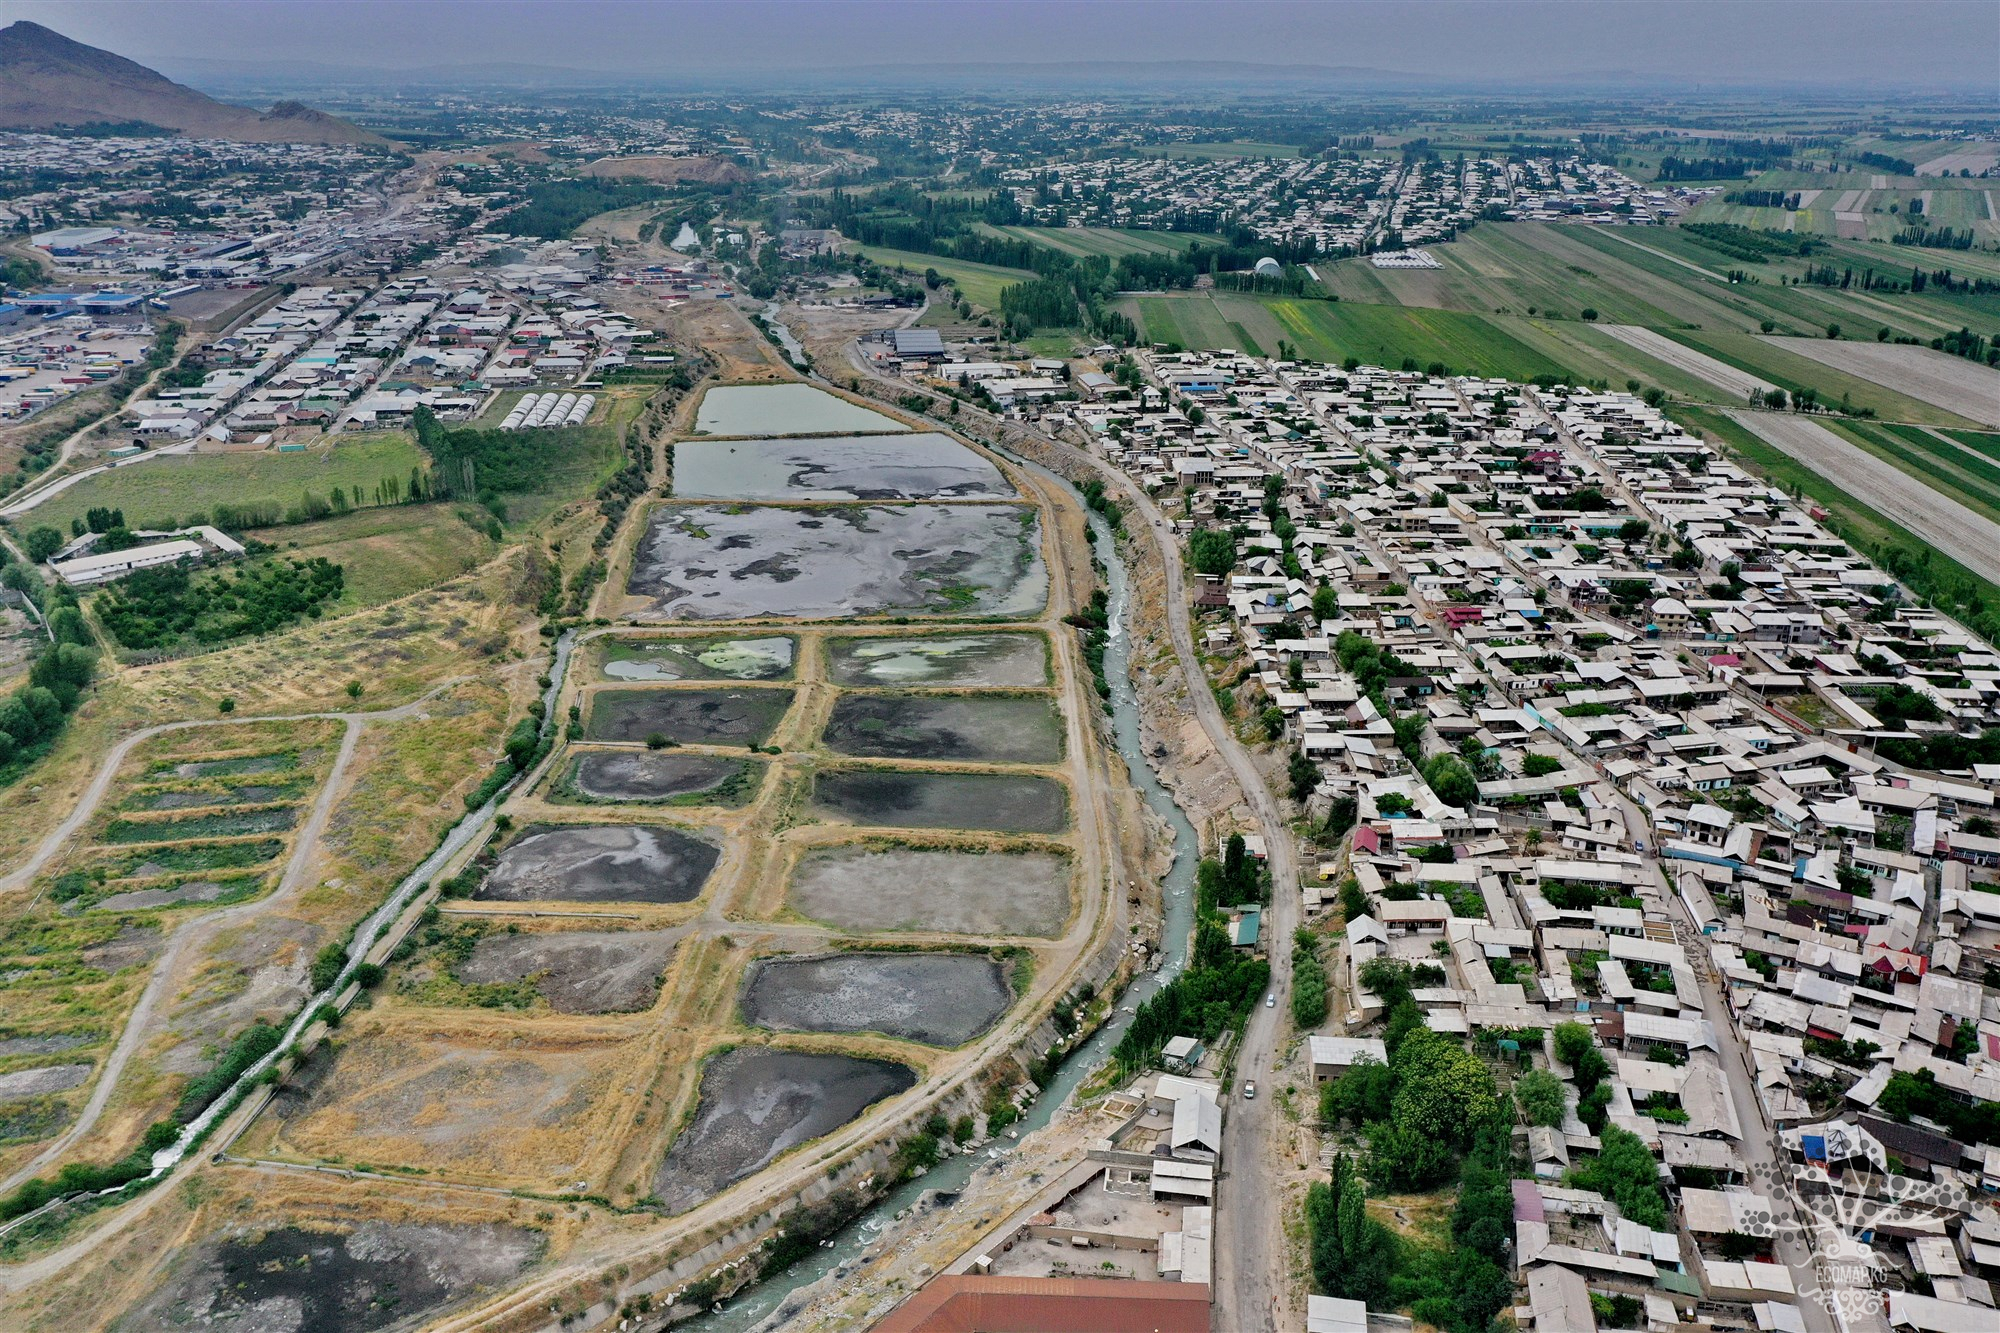
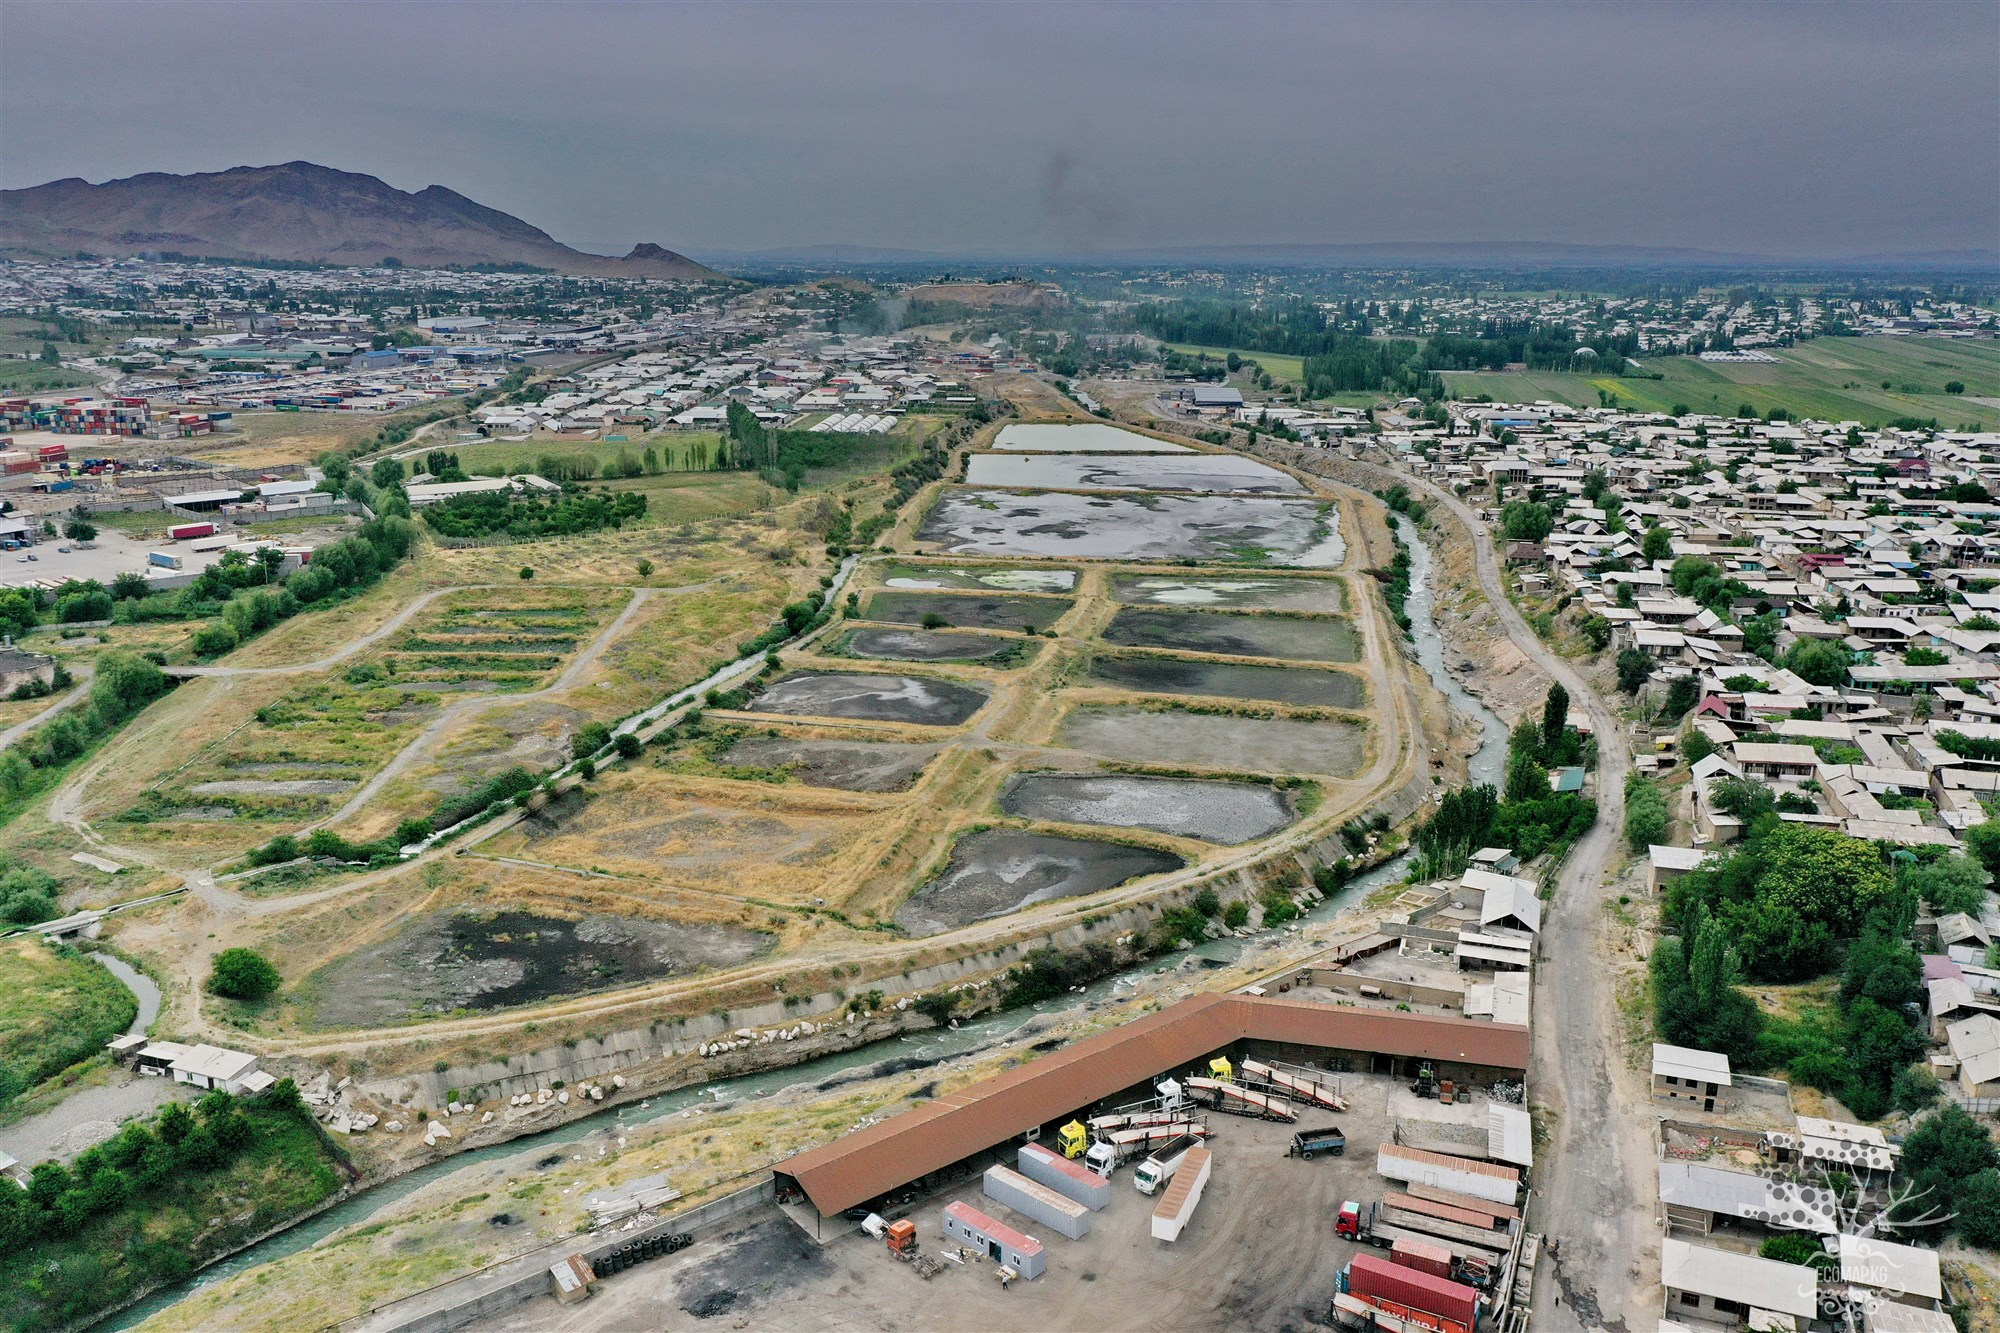
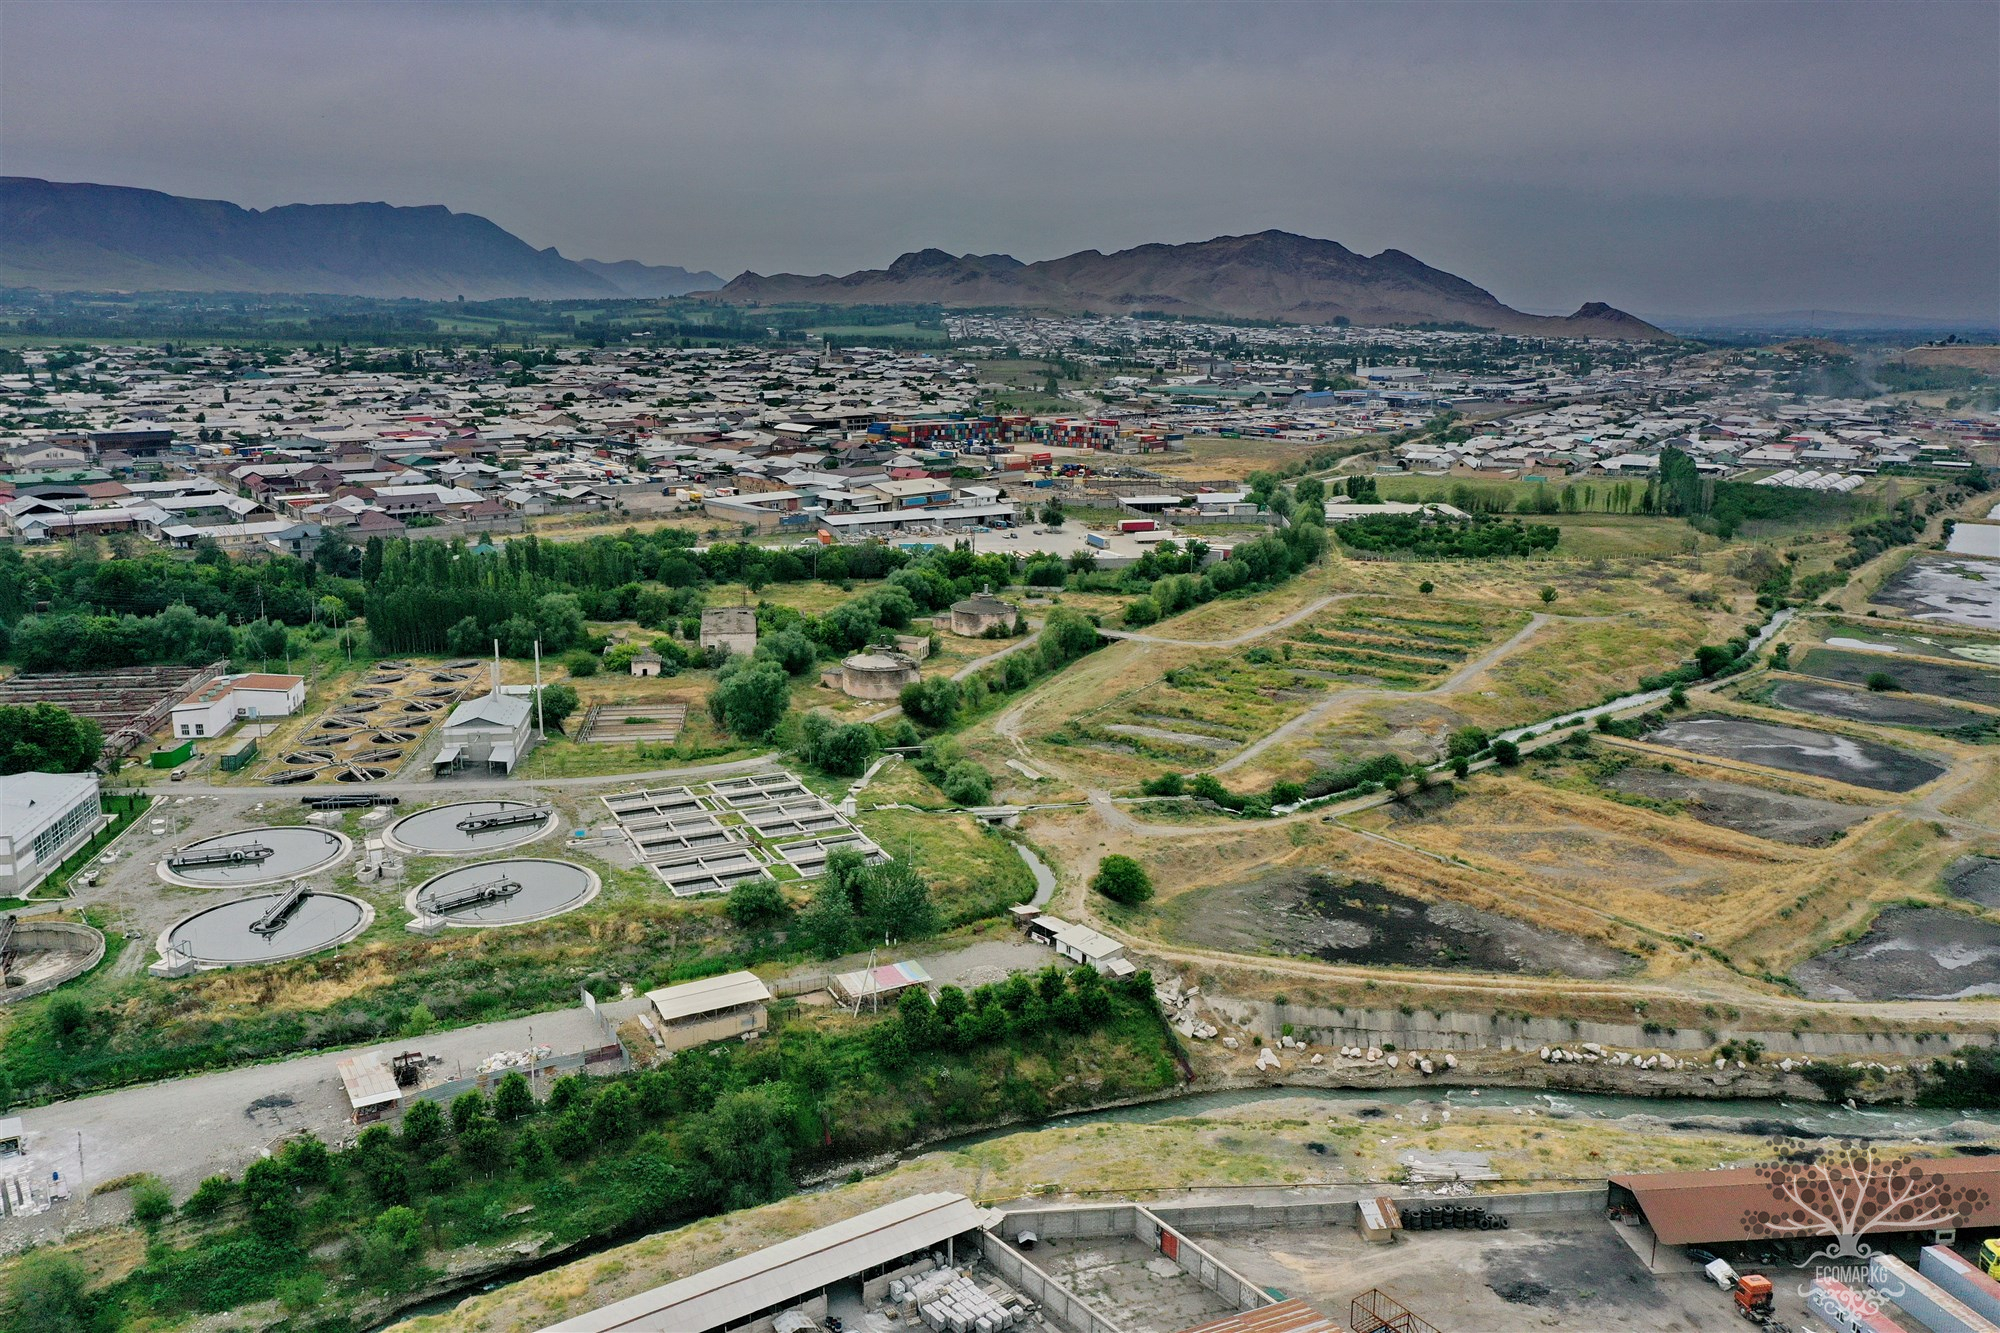
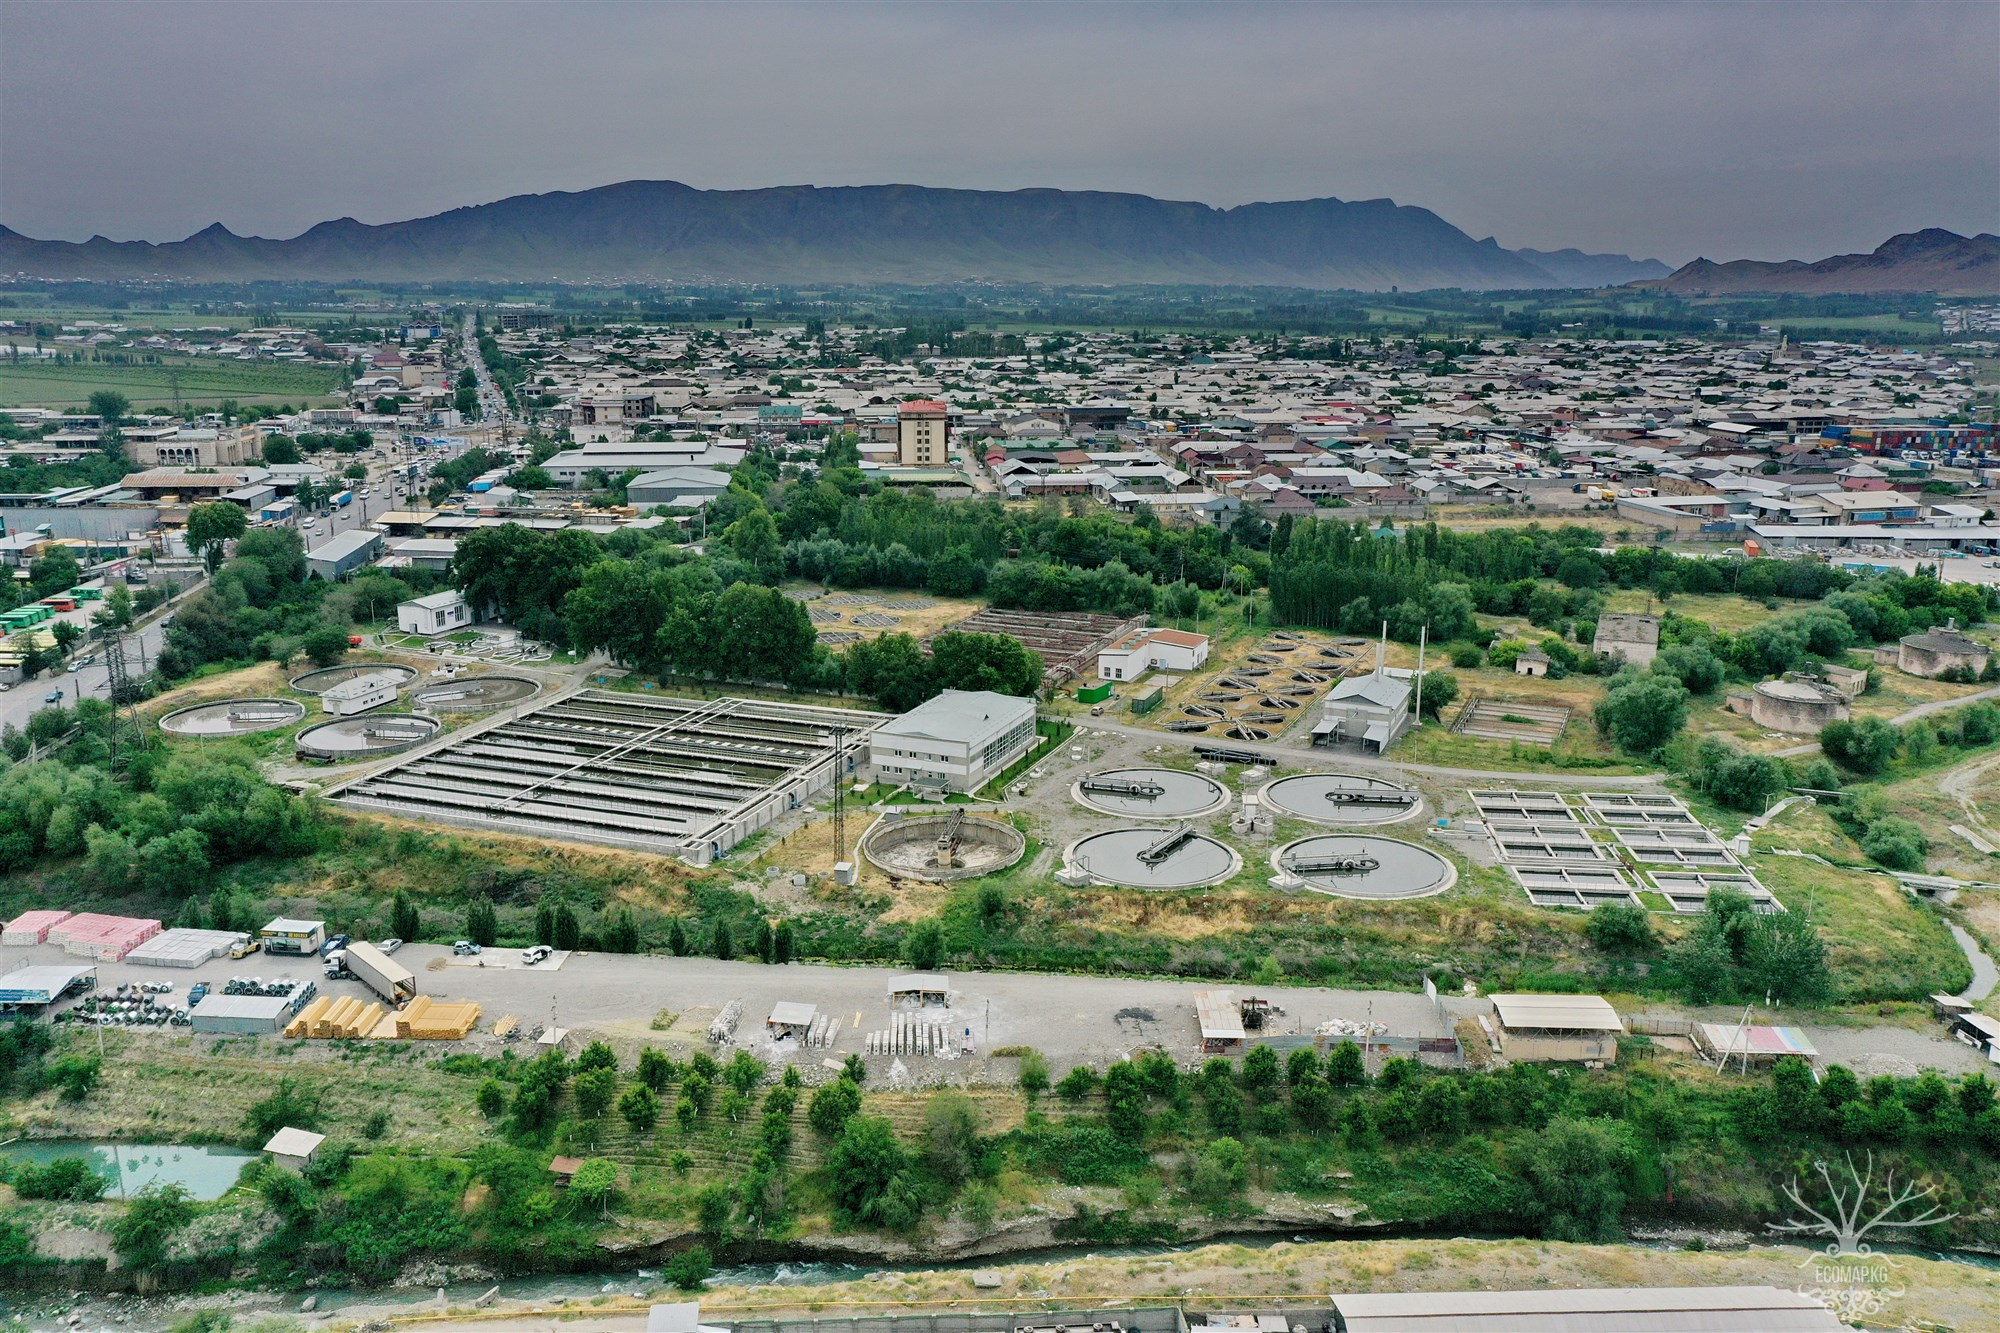
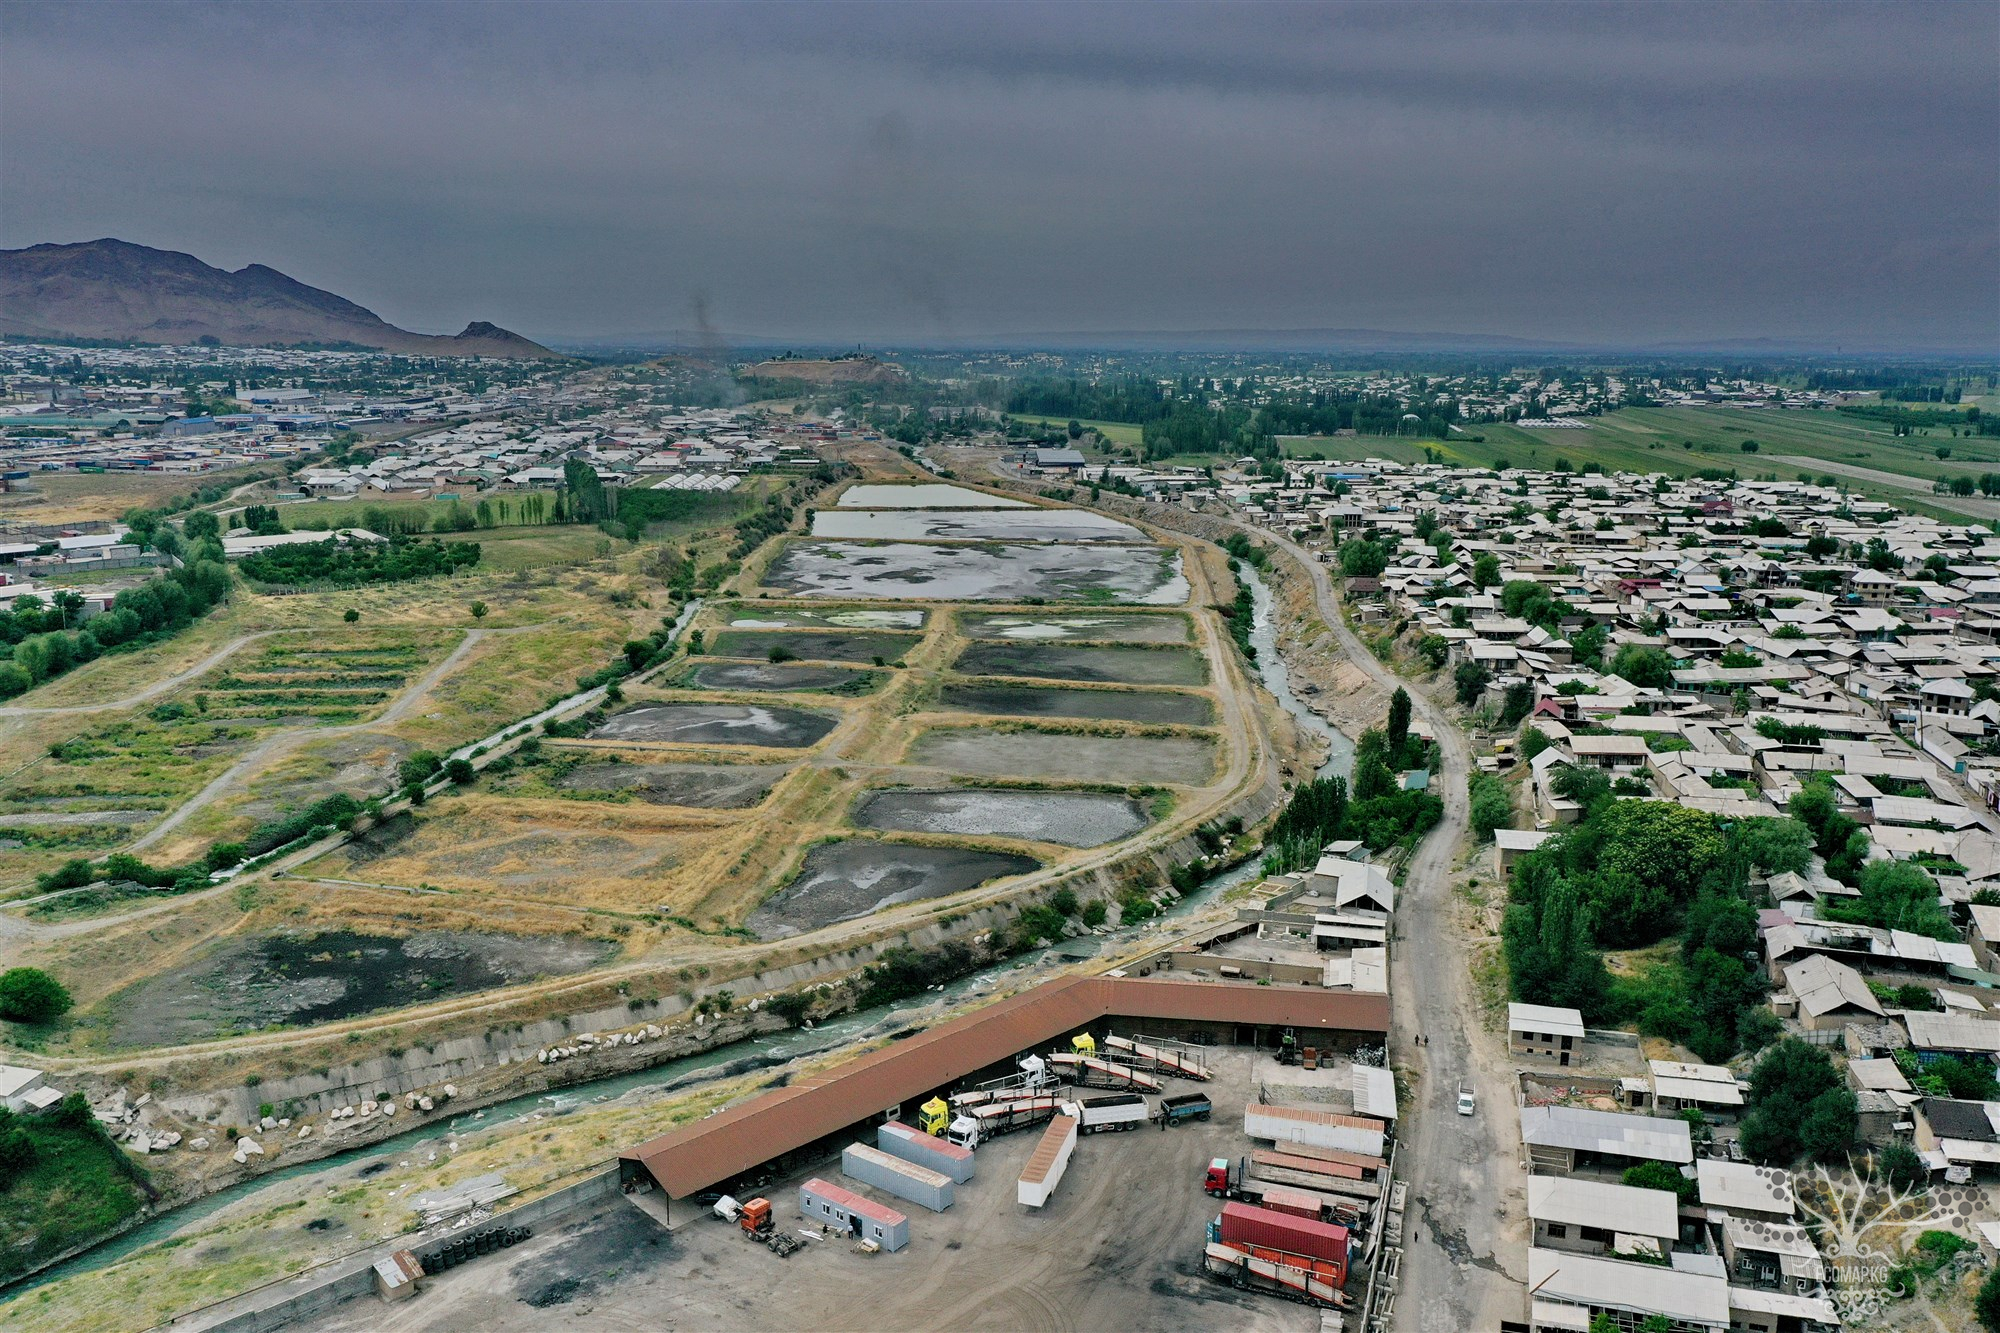
Municipal and some industrial wastewater from cities and urban-type settlements undergo treatment at municipal (city and settlement) wastewater treatment plants (WWTPs). As analysis shows, municipal pollution sources have a localized impact on watercourses over short stretches.
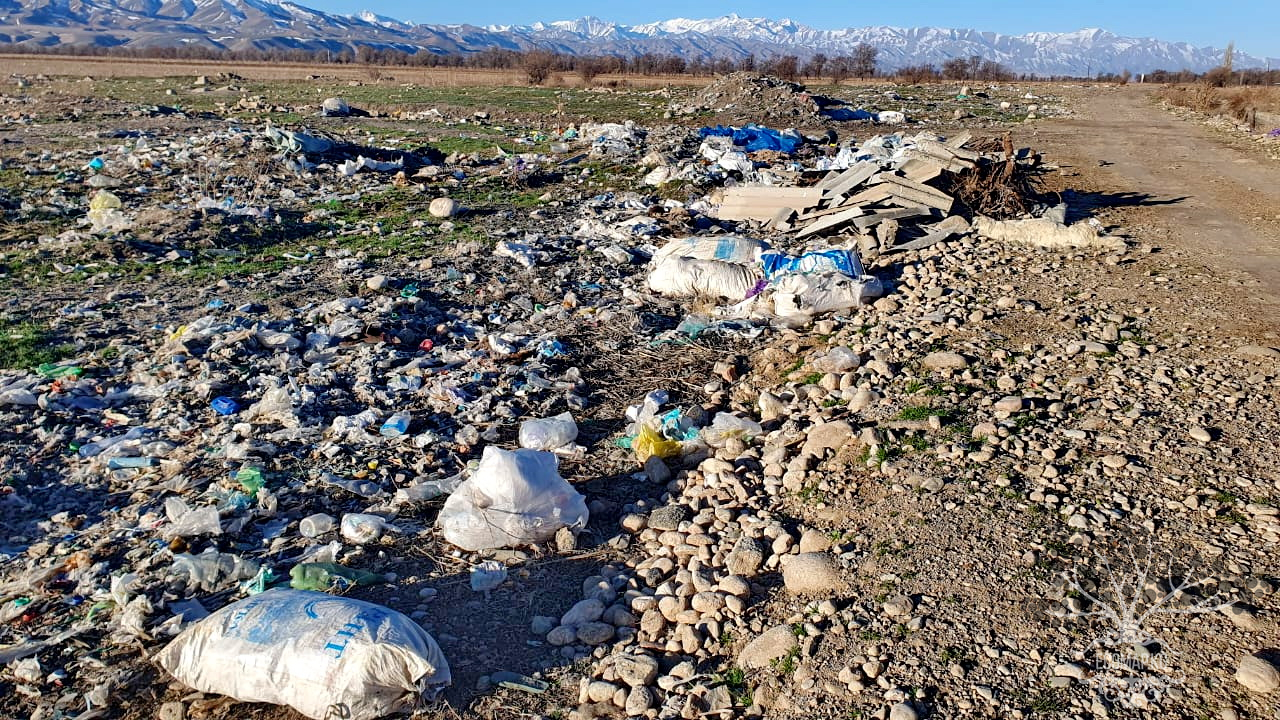
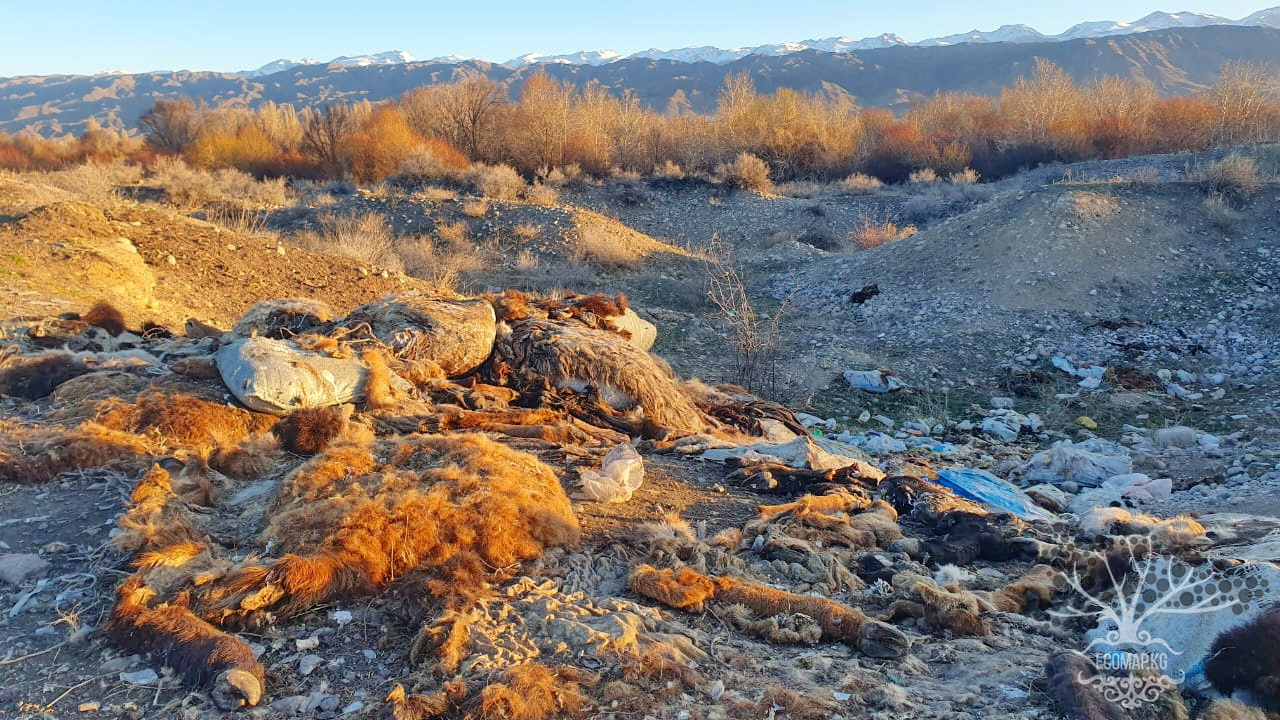
In rural areas, there are virtually no municipal sewage facilities and sewage systems. The construction of pit latrines (toilets), used everywhere, is the responsibility of each individual family or organization, such as government institutions and schools. Exceptions are the Chui and Osh regions, which directly surround the cities of Bishkek and Osh. However, even here the situation is complicated by internal migration processes that have led to a high population concentration in Bishkek. As a result, rings of new buildings have emerged around the capital that are not equipped with sewage systems. The accumulation and uncontrolled discharge of domestic wastewater from residential developments are directed into the collector-drainage network, onto the terrain, and into water bodies, leading to pollution of both groundwater and surface water.
Table 3.32
Wastewater Treatment Facilities (capacities for wastewater treatment and their efficiency), 2018
Wastewater treatment at municipal wastewater treatment plants (MWTPs)
Primary treatment (mechanical treatment)
Number of facilities 28
Design capacity (volume) Thousand cubic meters/day 756.9
Million cubic meters/year 276.3
Actual capacity Thousand cubic meters/day 591.3
Million cubic meters/year 215.8
Secondary treatment (biological treatment)
Number of facilities 13
Design capacity (volume) Thousand cubic meters/day 721.05
Million cubic meters/year 263.183
Actual capacity Thousand cubic meters/day 450.1
Million cubic meters/year 164.3
Treated wastewater in autonomous treatment facilities
Primary treatment
Number of facilities 116
Design capacity (volume) Thousand cubic meters/day 91.7
Million cubic meters/year 33.482
Actual capacity Thousand cubic meters/day 91.2
Million cubic meters/year 33.3
Secondary treatment
Number of facilities 89
Design capacity (volume) Thousand cubic meters/day 39.34
Million cubic meters/year 14.4
Actual capacity Thousand cubic meters/day 33.4
Million cubic meters/year 12.2
Source: GIEBT
According to the State Inspection of Environmental and Technical Safety under the Government of the Kyrgyz Republic, as of January 2019, there are 145 operational facilities for the treatment of domestic and industrial wastewater in the Kyrgyz Republic, including: 22 municipal treatment facilities, 123 departmental and private treatment facilities for mechanical and biological treatment of wastewater from enterprises and organizations, to which the population, resort and health facilities are connected, and 1 complex for physicochemical treatment of industrial wastewater.
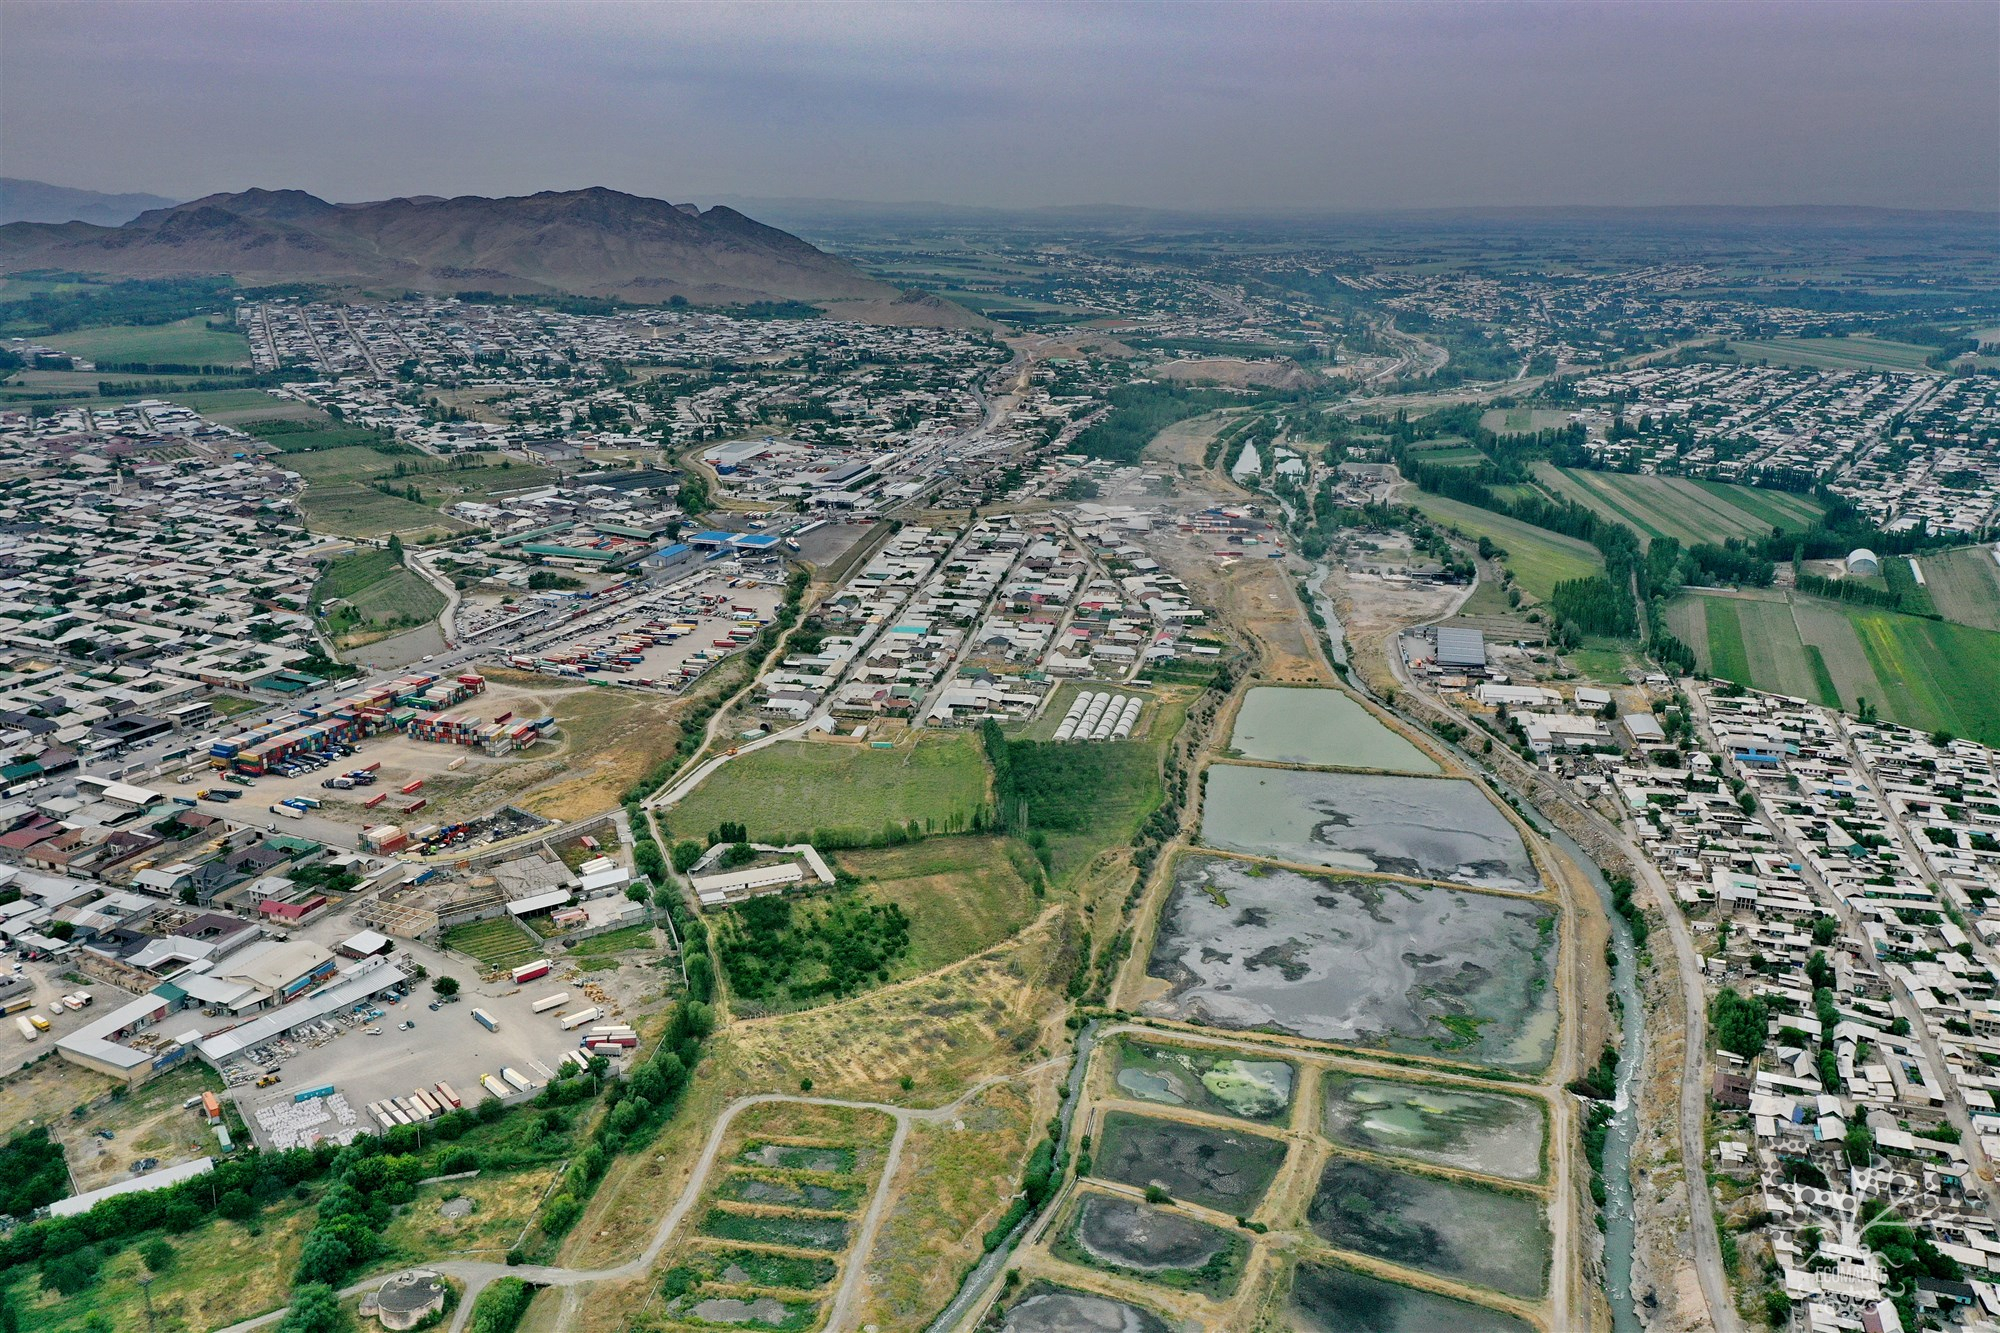
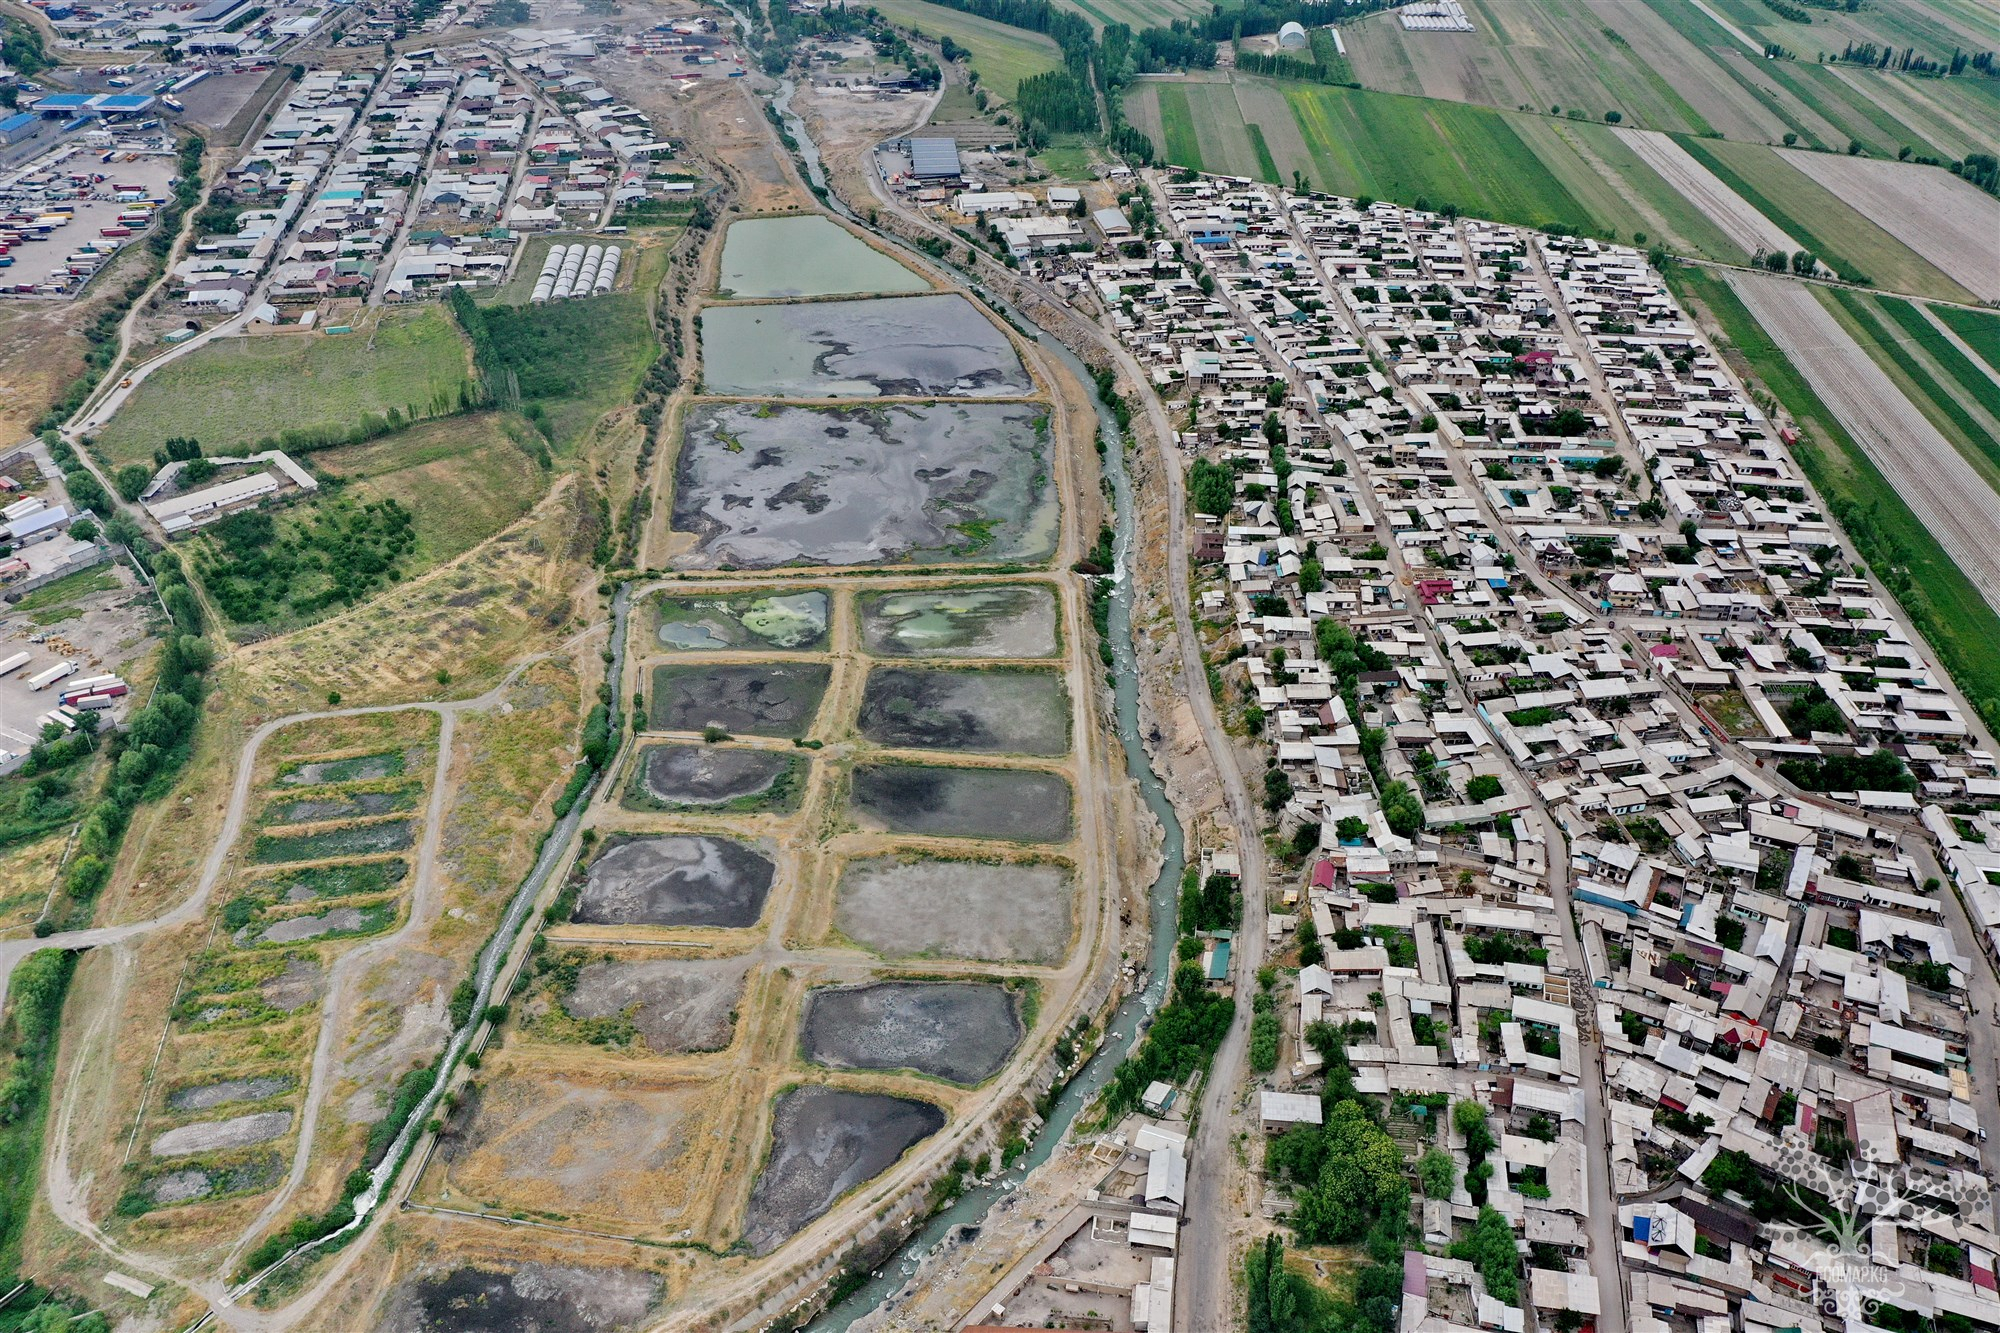
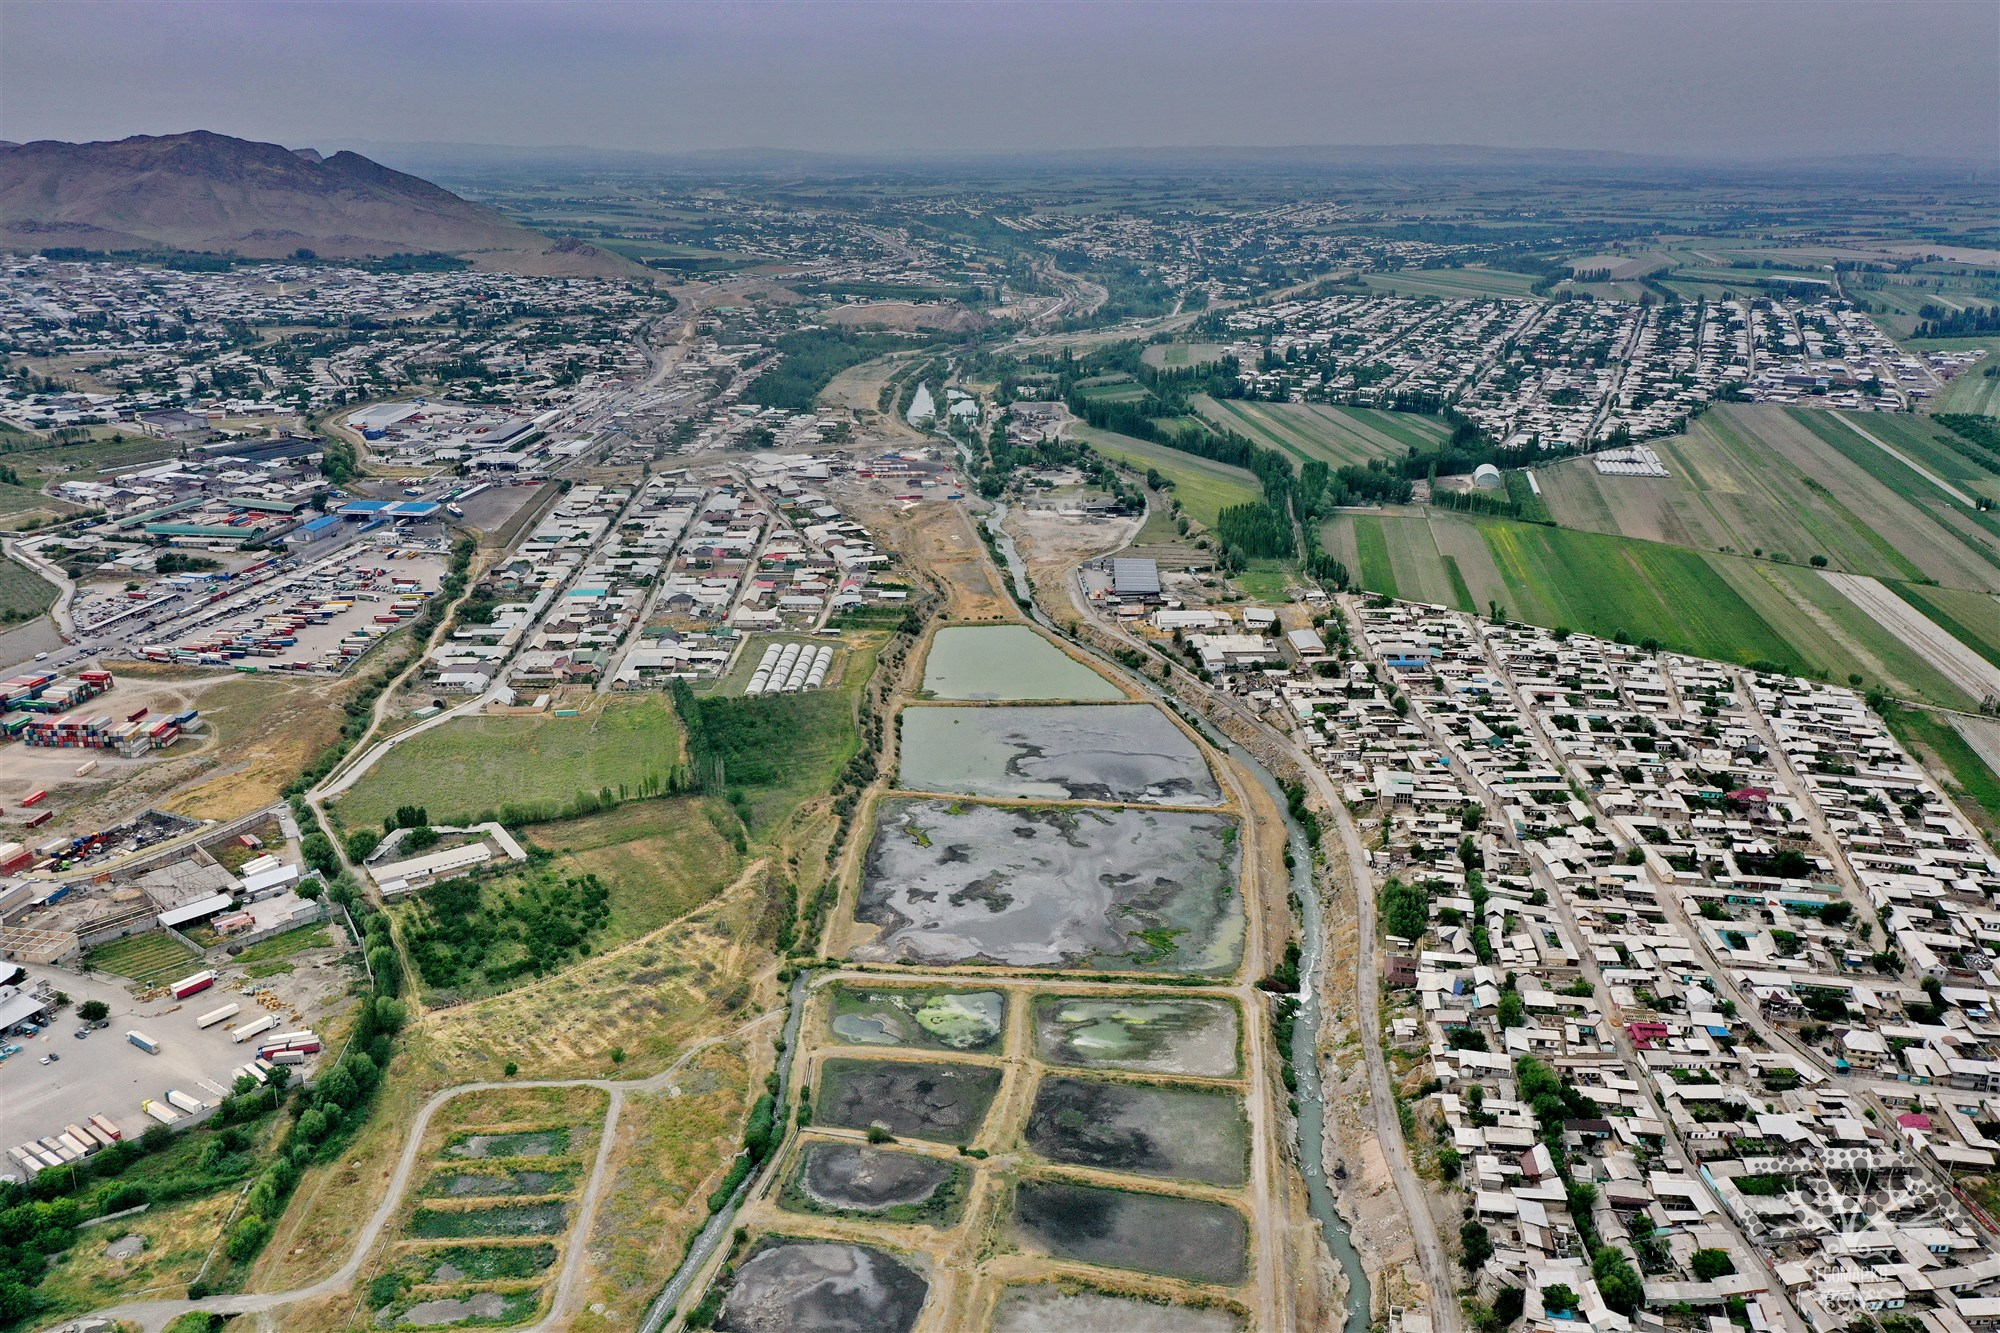
The discharge of wastewater after treatment at treatment facilities is carried out into the environment. Of the 145 wastewater treatment facilities: 14 discharge into surface water bodies, 5 into dry riverbeds and streams, 2 onto the terrain, 114 for irrigation and collector-drainage systems, and 10 into filtration and evaporation fields.
Considering that all municipal treatment facilities are biological treatment facilities, their design capacity is higher than the actual inflow for wastewater treatment by 1.6 times, indicating that the treatment facilities primarily operate in mechanical treatment mode, i.e., do not fulfill their intended purpose. In autonomous treatment facilities, the situation is somewhat better: the actual capacity is 1.1 times lower than the design capacity (Table 3.32). This may be related to the fact that all autonomous treatment facilities belong to private companies, which allocate more funds to maintain the operation of wastewater treatment facilities at the design level than municipal enterprises.
Analysis has shown that the number of municipal treatment facilities that treat wastewater from the population has decreased, and the trend of reduction continues. At the same time, new enterprises and health facilities in the Issyk-Kul region are being commissioned with modern treatment facilities. Given that the majority of wastewater is directed to municipal treatment facilities, maintaining them at the design level is one of the main tasks, as it helps to reduce the discharge of untreated and insufficiently treated wastewater.
The largest number of treatment facilities is located in the Chui and Issyk-Kul regions.
From 2015 to 2018, the discharge of wastewater into water sources increased across the republic from 99.9 million cubic meters to 101.1 million cubic meters, of which: the discharge of normatively treated wastewater increased from 94.5 million cubic meters to 96.1 million cubic meters. The discharge of insufficiently treated and untreated wastewater decreased by 0.5 million cubic meters.
At the same time, the reported discharge of untreated and insufficiently treated wastewater into water sources across the territory is not an indicator, as not all enterprises with wastewater treatment facilities on their balance sheets provide information to the National Statistics Committee (NSC). In addition, discharges from decentralized sewage systems in rural areas are not accounted for.
From 2015 to 2018, the discharge of normatively treated wastewater increased by 1.02%, while the discharge of untreated and insufficiently treated wastewater decreased by 20%.
Table 3.33
Discharge of wastewater into water sources, million cubic meters
Units of measurement 2015 2016 2017 2018
Total, including: million cubic meters 99.9 100.0 101.6 101.1
normatively treated water million cubic meters 94.5 93.5 95.4 96.1
untreated and insufficiently treated million cubic meters 2.4 2.1 2.1 1.9
per capita untreated cubic meters 0.4 0.3 0.3 0.3
Source: NSC
Figure 3.13. Discharge of wastewater into water sources, million cubic meters
Source: NSC
If we compare the actual discharge of wastewater into water bodies of 101.1 million cubic meters with the design capacity for biological treatment of wastewater treatment facilities of 228.004 million cubic meters/year, we can conclude that the design capacity of treatment facilities allows for the treatment of wastewater by additionally connecting sources of their formation, including the population living in the private sector.
The largest volume of discharged untreated wastewater is in the Chui region at 1.1 million cubic meters.
Table 3.34
Discharge of untreated and insufficiently treated wastewater into water sources by territory
Units of measurement 2015 2016 2017 2018
Kyrgyz Republic million cubic meters 2.4 2.1 2.1 1.9
Batken region million cubic meters 0.1 0.1 0.1 0.1
Jalal-Abad region million cubic meters 0.4 0.7 0.7 0.7
Issyk-Kul region million cubic meters 0.1 0.2 0.2 0.0
Talas region million cubic meters 0.3 - - -
Chui region million cubic meters 1.5 1.1 1.1 1.1
City of Bishkek million cubic meters
Source: NSC
Collector-drainage waters
Collector-drainage waters are one of the sources of water pollution. Sulfates, chlorides, and sodium ions prevail in CDWs. In the Kyrgyz Republic, there are 5705.0 km of collector-drainage networks (CDN), of which inter-farm collector-drainage networks account for 650.4 km and intra-farm CDN 5054.6 km. To monitor groundwater levels in the republic, there are 2362 wells in the regime network, of which 1374 or 58% of the wells are not operational. The total discharge of CDWs has remained virtually unchanged, and from 2015 to 2018, the average volume of CDWs amounted to 1.12 cubic kilometers, of which the mineralization ranged from 1 to 3 g/l - 0.11 cubic kilometers, and less than 1 g/l - 1.01 cubic kilometers (Table 3.35).
According to the data from the Meliorative Hydrogeological Expedition, the collector-drainage network in the Chui region, where the drainage area is 118.1 thousand hectares, which accounts for 82% of the total drainage area in the republic, produces a collector-drainage discharge of 875.8 thousand cubic meters, which is 73% of the total republican collector-drainage discharge. Therefore, the watercourses of the Chui river basin are most susceptible to pollution from return waters. The chemical composition of the Chu River and its tributaries is significantly influenced by return waters from fields, saturated with salts. The CDN is most developed in the northwestern and central parts of the Chui region, where the Ak-Suu and Kara-Balta rivers flow.
Table 3.35
Quantity and quality of collector-drainage waters by mineralization
Years Quantity of CDN, cubic km
Total mineralization <1.0 g/l mineralization 1.0-3.0 g/l mineralization >3.0 g/l
2015 1.07 0.88 0.19 -
2016 1.14 1.06 0.08 -
2017 1.15 1.07 0.08 -
2018 1.13 1.05 0.08 -
Source: Meliorative Hydrogeological Expedition GAVR
Table 3.36
Water-salt balance by regions of the Kyrgyz Republic for 2018
Region name Salt inflow for the year, tons Salt outflow for the year, tons Changes
+ -
Total for the republic 157463 594099 433732
Chui region 118279 391033 278754
Osh region 6016 67819 61803
Batken region 9640 73410 63770
Talas region 4701 15040 10339
Naryn region 8081 14074 6993
Issyk-Kul region 3925 15078 11863
Jalalabad region 6821 9935 3114
Source: Meliorative Hydrogeological Expedition GAVR
From Table 3.36, it follows that the outflow of salts with collector-drainage waters exceeds their inflow by more than 3 times. Sulfates, chlorides, and sodium ions prevail in CDWs. They also contain pesticides, nitrogen, and phosphate compounds. It has been established that, on average, up to 25% of nitrogen and 5% of phosphate from the applied amount are carried away from irrigated fields into the collectors.
The research was conducted with the support of the Global Greengrants Fund (GGF), one of the leading donor organizations in the world that supports the efforts of ordinary people to protect the planet Earth.
#GlobalGreengrantsFund #GreengrantsFund #Greengrants #GGF #GlobalGreengrantsFund
#GlobalGreengrantsFund #GreengrantsFund #Greengrants #GGF #GlobalGreengrantsFund


Attention: Information based on submitted complaints